Volume 13, Number 1—January 2007
Dispatch
Gastroenteritis Caused by Norovirus GGII.4, the Netherlands, 1994–2005
J. Joukje Siebenga*† , Harry Vennema*, Erwin Duizer*, and Marion P.G. Koopmans*†
Figure
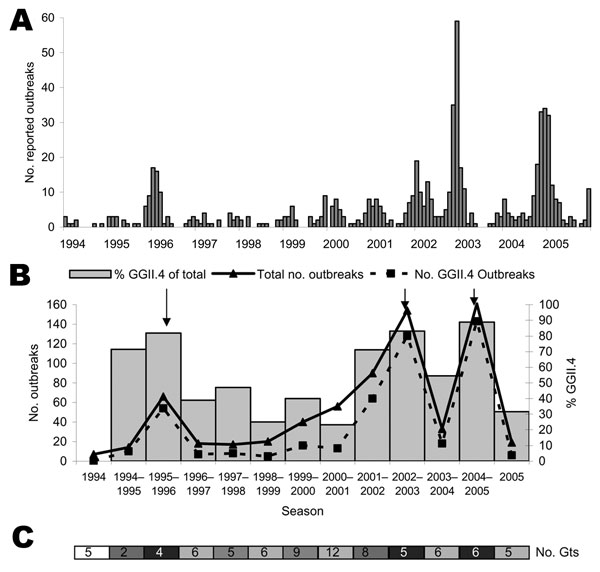
Figure. A) Number of norovirus outbreaks reported per month in the Netherlands, 1994–2005. B) Total no. of outbreaks per season and fraction of GGII.4 outbreaks reported in the Netherlands. Total no. is indicated by the solid line, no. of GGII.4 outbreaks by the dotted line (values on left y-axis), bars indicate percentage of GGII.4 outbreaks of the total no. (values on right y-axis), and arrows indicate epidemic seasons. Seasons run from July through June. C) Total no. of genotypes (Gts) circulating per season. Shading of the bar indicates the percentage of GGII.4, ranging from white (0%–20%), in steps of 20%, to black (80%–100%).
Page created: July 01, 2010
Page updated: July 01, 2010
Page reviewed: July 01, 2010
The conclusions, findings, and opinions expressed by authors contributing to this journal do not necessarily reflect the official position of the U.S. Department of Health and Human Services, the Public Health Service, the Centers for Disease Control and Prevention, or the authors' affiliated institutions. Use of trade names is for identification only and does not imply endorsement by any of the groups named above.