Volume 14, Number 12—December 2008
Dispatch
Novel Borna Virus in Psittacine Birds with Proventricular Dilatation Disease
Figure 2
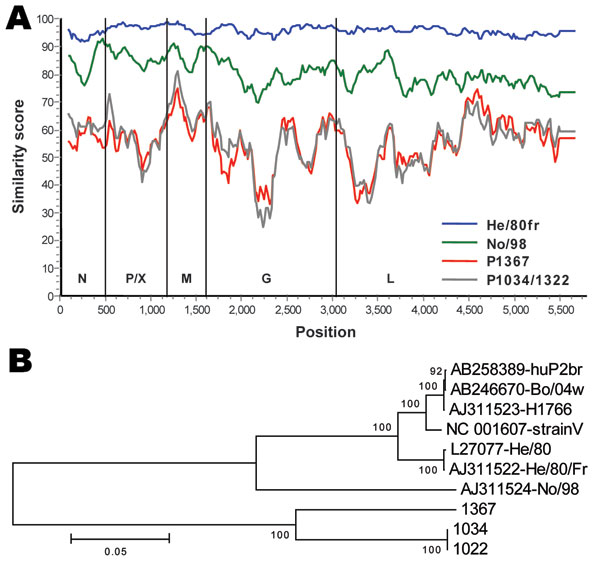
Figure 2. A) Similarity plot between Borna disease virus (BDV) prototype strain V nucleotide sequence and those of characterized BDV strains He/80fr and No/98 compared with novel strains 1367 and 1034/1322. Gene regions corresponding to the nucleoprotein (N), phosphoprotein (P), X protein (X), matrix protein (M), glycoprotein (G) and L-polymerase protein (L), and nucleotide positions are indicated. B) A tree representing the evolutionary history was inferred by using the neighbor-joining method. The percentage of replicate trees in which the associated taxa clustered together in the bootstrap test (500 replicates) is shown next to the branches. The tree is drawn to scale with branch lengths in the same units as those of the evolutionary distances used to infer the phylogenetic tree (number of base substitutions per site; see scale bar). Evolutionary distances were computed by using a Kimura 2-parameter model; a total of 5,449 positions in the final dataset were analyzed by using MEGA4 software (www.megasoftware.net).