Volume 14, Number 3—March 2008
Research
Integrated Food Chain Surveillance System for Salmonella spp. in Mexico1
Mussaret B. Zaidi* , Juan Jose Calva†, Maria Teresa Estrada-Garcia‡, Veronica Leon*, Gabriela Vazquez§, Gloria Figueroa§, Estela Lopez¶, Jesus Contreras#, Jason Abbott**, Shaohua Zhao**, Patrick McDermott**, and Linda Tollefson††
Figure 1
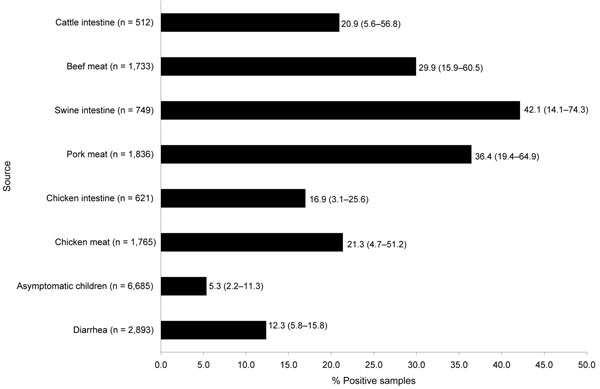
Figure 1. Percentage of human, retail meat, and food-animal samples positive for Salmonella spp. detected by an integrated food chain system in Mexico, 2002–2005. Numbers to the right of bars indicate average values, and numbers in parentheses indicate the frequency of positive samples in the states with the lowest and highest prevalence, respectively. The number of specimens examined from each source (n) is shown next to each source heading.
1Presented in part at the International Association for Food Protection 93rd Annual Meeting, August 13–16, 2006, Calgary, Alberta, Canada.
Page created: July 07, 2010
Page updated: July 07, 2010
Page reviewed: July 07, 2010
The conclusions, findings, and opinions expressed by authors contributing to this journal do not necessarily reflect the official position of the U.S. Department of Health and Human Services, the Public Health Service, the Centers for Disease Control and Prevention, or the authors' affiliated institutions. Use of trade names is for identification only and does not imply endorsement by any of the groups named above.