Volume 15, Number 4—April 2009
THEME ISSUE
The Amazon Region
Dispatches
Links between Climate, Malaria, and Wetlands in the Amazon Basin
Figure 2
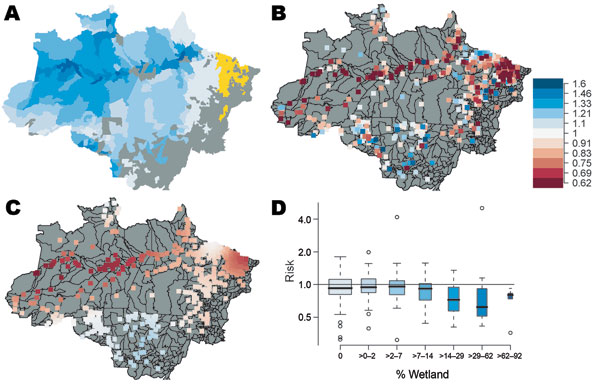
Figure 2. Connection of malaria incidence and precipitation risk ratios to wetlands. A) Percentage of wetlands in Amazon Basin counties (shades of blue), counties without wetlands data (yellow), and counties with <80 total malaria cases (gray). Wetland colors correspond to percentage wetland values in panel D. B) Risk ratios for malaria incidence for 1 SD (≈14 cm) change in monthly precipitation (January 1996–December 1999), plotted at each county seat of government; C) spatially smoothed risk ratios for ≈14-cm changes in monthly precipitation. In both panels, red shaded squares show reduced risk for ≈14-cm increase in monthly precipitation; blue shaded squares show increased risk for malaria with increased precipitation. D) Boxplot of risk ratios for malaria incidence for ≈14-cm changes in monthly precipitation, by percentage wetland cover. Box width is proportional to the number of counties in each box. Error bars indicate interquartile ranges, and thick horizontal bars indicate the median.