Volume 15, Number 7—July 2009
Dispatch
Epidemiology of Human T-cell Lymphotropic Virus Type 1 Infection in Blood Donors, Israel
Figure 2
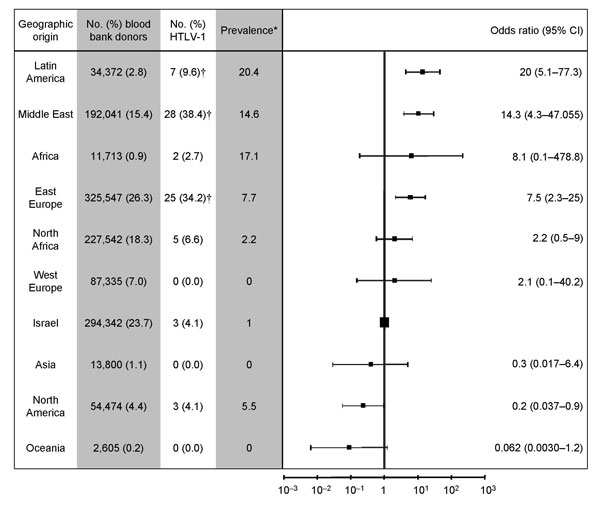
Figure 2. . Relative risk for human T-cell lymphotropic virus type 1 carriage in donors from different geographic origins. Odds ratios (indicated by black boxes) are charted in logarithmic scale. Error bars indicate 95% confidence intervals (CI). *Per 100,000 population; †p<0.05.
Page created: September 14, 2012
Page updated: September 14, 2012
Page reviewed: September 14, 2012
The conclusions, findings, and opinions expressed by authors contributing to this journal do not necessarily reflect the official position of the U.S. Department of Health and Human Services, the Public Health Service, the Centers for Disease Control and Prevention, or the authors' affiliated institutions. Use of trade names is for identification only and does not imply endorsement by any of the groups named above.