Volume 16, Number 12—December 2010
Research
Anatomy of Bluetongue virus Serotype 8 Epizootic Wave, France, 2007-2008
Figure 2

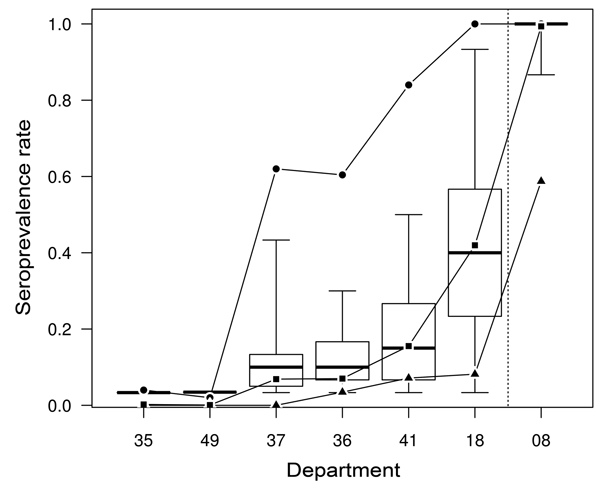
Figure 2. Results from a serologic study of the 2007 epizootic wave of bluetongue virus serotype 8 (BTV-8) in France among cattle herds from an east–west transect of 6 departments (codes 18, 41, 36, 37, 49 and 35) and from the first department to report BTV-8 infection in 2006 (code 08). Circles, herd-level anti–BTV-8 seroprevalence rate; squares, animal-level seroprevalence rate; triangles, proportion of seropositive herds having reported confirmed clinical cases in 2007; box plots, distribution of within-herd seroprevalence rates. Thick horizontal lines represent the median value of the distribution. Rectangles represent the 25th and 75th percentiles. Error bars represent the maximum and minimum values observed in the distribution.
Page created: August 28, 2011
Page updated: October 04, 2011
Page reviewed: October 04, 2011
The conclusions, findings, and opinions expressed by authors contributing to this journal do not necessarily reflect the official position of the U.S. Department of Health and Human Services, the Public Health Service, the Centers for Disease Control and Prevention, or the authors' affiliated institutions. Use of trade names is for identification only and does not imply endorsement by any of the groups named above.