Volume 16, Number 12—December 2010
Dispatch
Increasing Contact with Hepatitis E Virus in Red Deer, Spain
Figure

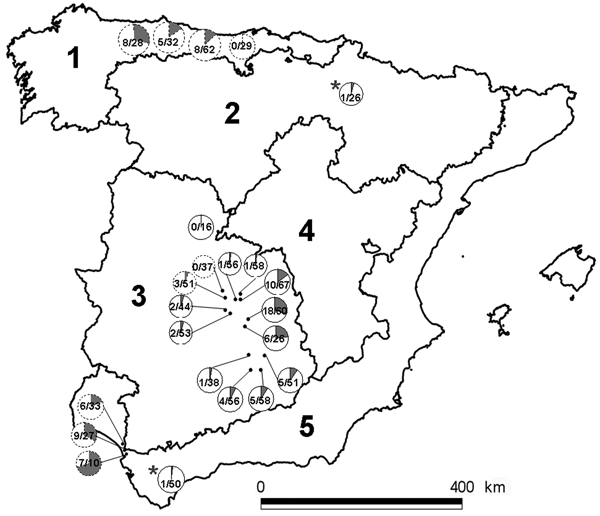
Figure. The 5 peninsular bioregions (nos. 1–5) and the 21 sampling sites, Spain. Pie charts indicate local prevalence (in gray). Numbers indicate positive animals/sampled animals. Broken line borders indicate open sites; solid lines indicate fenced estates; asterisks indicate the 2 red deer farms.
Page created: August 28, 2011
Page updated: August 28, 2011
Page reviewed: August 28, 2011
The conclusions, findings, and opinions expressed by authors contributing to this journal do not necessarily reflect the official position of the U.S. Department of Health and Human Services, the Public Health Service, the Centers for Disease Control and Prevention, or the authors' affiliated institutions. Use of trade names is for identification only and does not imply endorsement by any of the groups named above.