Volume 16, Number 3—March 2010
Research
Serologic Markers for Detecting Malaria in Areas of Low Endemicity, Somalia, 2008
Figure 1

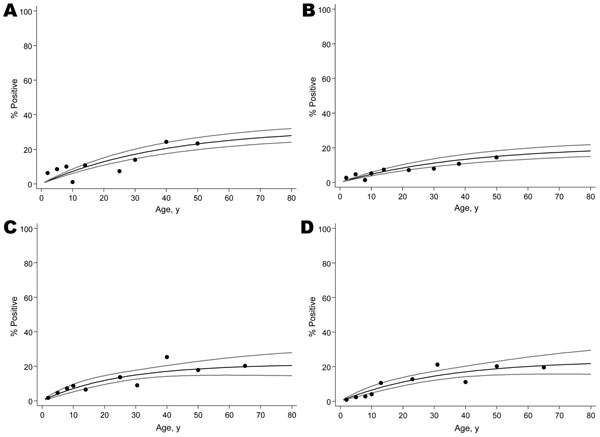
Figure 1. Seroprevalence data for antibodies against A) Plasmodium falciparum merozoite surface protein 119 (MSP-119), B) P. falciparum apical membrane antigen 1 (AMA-1), C) P. vivax MSP-119, and D) P. vivax AMA-1 by age in the study population, Somalia, 2008. Gray lines indicate 95% confidence intervals. Seroconversion rates (95% confidence intervals) were as follows: P. falciparum MSP-119 0.0082 (0.0068–0.097); AMA-1 0.0053 (0.0042–0.0066); P. vivax MSP-119 0.0086 (0.0055–0.0133); AMA-1 0.0075 (0.0050–0.0112).
Page created: December 14, 2010
Page updated: December 14, 2010
Page reviewed: December 14, 2010
The conclusions, findings, and opinions expressed by authors contributing to this journal do not necessarily reflect the official position of the U.S. Department of Health and Human Services, the Public Health Service, the Centers for Disease Control and Prevention, or the authors' affiliated institutions. Use of trade names is for identification only and does not imply endorsement by any of the groups named above.