Volume 17, Number 1—January 2011
Research
Foodborne Illness Acquired in the United States—Major Pathogens
Figure
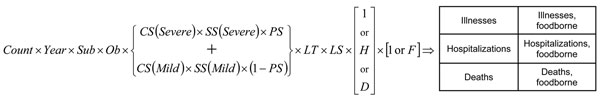
Figure. Example schematic diagram of the estimation and uncertainty model used to estimate episodes of illness, hospitalizations, and deaths in the United States. Count, data (empirical distribution); Year, factor to standardize non-2006 counts to 2006 (constant); Sub, expansive factor to scale area surveillance to the entire US population (constant); Ob, expansive factor to scale outbreak counts up to outbreak plus sporadic counts (beta distribution); CS, expansive factor to scale care seekers to all ill, with severe and mild illness versions (PERT distribution); SS, expansive factor to scale submitted samples to all visits, with severe and mild illness versions (PERT distribution); PS, estimated proportion of illnesses that are severe (PERT distribution); LT, expansive factor to scale tests performed up to samples submitted (PERT distribution); LS, expansive factor to scale positive test results up to true positive specimens (PERT distribution); H, contractive factor to scale illnesses down to hospitalized illnesses (PERT distribution); D, contractive factor to scale illnesses down to deaths (PERT distribution); F, contractive factor to scale illnesses down to foodborne illnesses (PERT distribution).
1Current affiliation: Colorado School of Public Health, Aurora, Colorado, USA.