Skip directly to site content Skip directly to page options Skip directly to A-Z link Skip directly to A-Z link Skip directly to A-Z link
Volume 17, Number 11—November 2011
Letter

Mosquito-associated Dengue Virus, Key West, Florida, USA, 2010

Amanda S. Graham, Catherine A. Pruszynski, Lawrence J. Hribar, David J. DeMay, Adriane N. Tambasco, Anne E. Hartley, Edsel M. Fussell, Scott F. Michael, and Sharon IsernComments to Author 
Author affiliations: Florida Gulf Coast University, Fort Myers, Florida, USA (A.S. Graham, A.E. Hartley, S.F. Michael, S. Isern); Florida Keys Mosquito Control District, Key West, Florida, USA (C.A. Pruszynski, L.J. Hribar, D.J. DeMay, A.N. Tambasco, E.M. Fussell)

Main Article

Figure A1

A) Mosquito collection locations, Key West, Florida, USA, January 27–December 17, 2010. Inset shows Key West. Red squares indicate locations of dengue virus serotype 1 (DENV-1)–positive mosquito pools. Yellow circles indicate locations of negative mosquito pools. The longitude and latitude of Key West are 24°33′20.53′′ N, 81°46′57.33′′W. B) Maximum-likelihood phylogenetic tree of the 1,484-nt envelope gene region from American DENV-1 isolates. Sequences are labeled with GenBank accession numbers

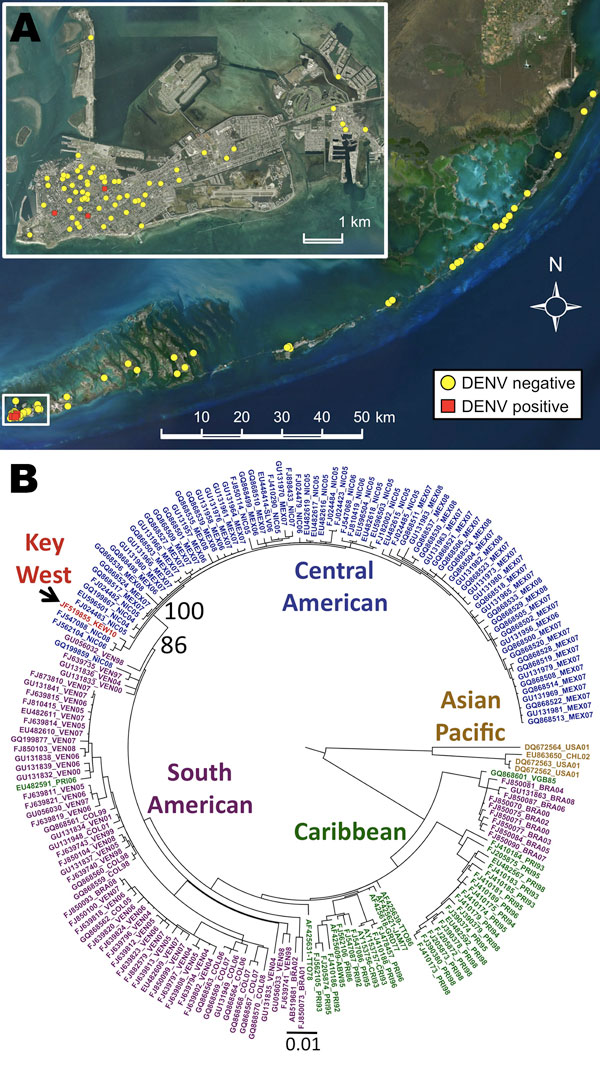
Figure A1. A) Mosquito collection locations, Key West, Florida, USA, January 27–December 17, 2010. Inset shows Key West. Red squares indicate locations of dengue virus serotype 1 (DENV-1)–positive mosquito pools. Yellow circles indicate locations of negative mosquito pools. The longitude and latitude of Key West are 24°33′20.53′′ N, 81°46′57.33′′W. B) Maximum-likelihood phylogenetic tree of the 1,484-nt envelope gene region from American DENV-1 isolates. Sequences are labeled with GenBank accession numbers, country, and year. Countries are given as standard 3-letter codes. Scale bar indicates number of substitutions per site. The Key West sequence is shown in red; Central American sequences, in blue; Caribbean sequences, in green; South American sequences, in purple, Asian/Pacific sequences, in gold. Percentage bootstrap values are shown for the nodes that separate the Central American clade (86%) and for the node that separates the clade containing the Key West virus and its 2 closest relatives (100%). Isolates from Hawaii (USA) and Easter Island (CHI) are of Asian origin and form an outgroup. Viruses group by geography and by year. Selected percentage bootstrap values are shown. Tree was drawn by using FigTree software (http://tree.bio.ed.ac.uk/software/figtree).

Main Article

Page created: October 24, 2011
Page updated: October 24, 2011
Page reviewed: October 24, 2011
The conclusions, findings, and opinions expressed by authors contributing to this journal do not necessarily reflect the official position of the U.S. Department of Health and Human Services, the Public Health Service, the Centers for Disease Control and Prevention, or the authors' affiliated institutions. Use of trade names is for identification only and does not imply endorsement by any of the groups named above.
file_external