Volume 17, Number 3—March 2011
Research
Swine Influenza Virus Antibodies in Humans, Western Europe, 2009
Nancy A. Gerloff, Jacques R. Kremer, Emilie Charpentier, Aurélie Sausy, Christophe M. Olinger, Pierre Weicherding, John Schuh, Kristien Van Reeth, and Claude P. Muller
Figure
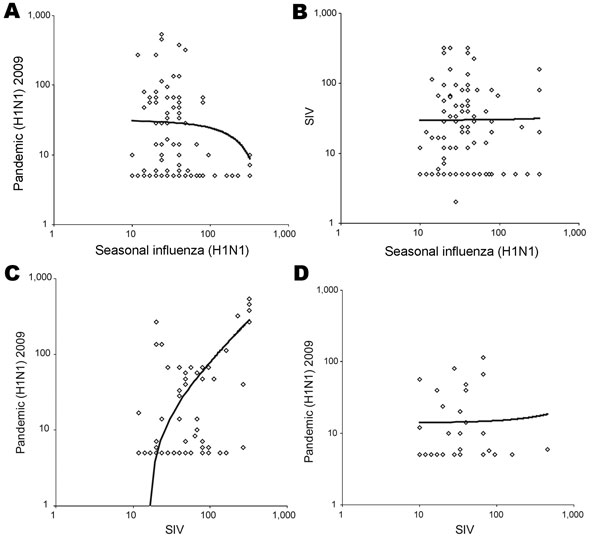
Figure. Geometric mean titers (>10) of antibodies against pandemic (H1N1) 2009 virus, seasonal influenza (H1N1) virus, and swine influenza virus of swine workers (A, B, C) and controls (D). Each symbol represents titer of 1 person; only persons with positive results (>10) for at least 1 of the 2 viruses of the panel are shown. Trend lines are shown; R2 values were R2>0.01 for panels A, B, and D and R2 = 0.5 for panel C.
Page created: July 25, 2011
Page updated: July 25, 2011
Page reviewed: July 25, 2011
The conclusions, findings, and opinions expressed by authors contributing to this journal do not necessarily reflect the official position of the U.S. Department of Health and Human Services, the Public Health Service, the Centers for Disease Control and Prevention, or the authors' affiliated institutions. Use of trade names is for identification only and does not imply endorsement by any of the groups named above.