Volume 17, Number 3—March 2011
Dispatch
Mycobacterium caprae Infection in Livestock and Wildlife, Spain
Sabrina Rodríguez, Javier Bezos, Beatriz Romero, Lucía de Juan, Julio Álvarez, Elena Castellanos, Nuria Moya, Francisco Lozano, M. Tariq Javed, José L. Sáez-Llorente, Ernesto Liébana, Ana Mateos, Lucas Domínguez, Alicia Aranaz , Monitoring of Animal Tuberculosis1, and The Spanish Network on Surveillance
Figure 2
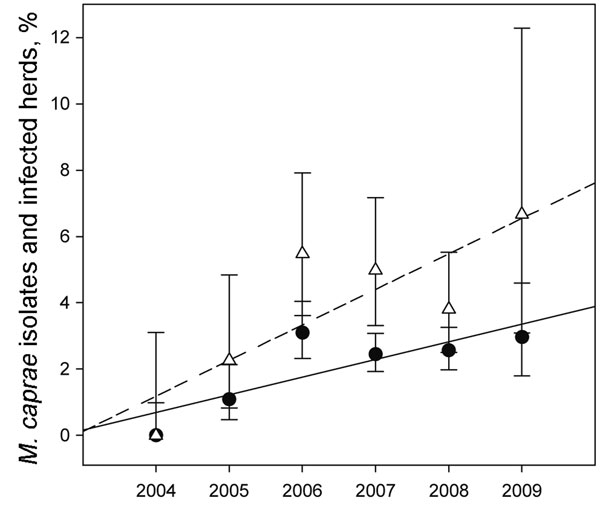
Figure 2. Proportion and regression lines of Mycobacterium caprae isolates (black dots, continuous line) and M. caprae–infected herds (white triangles, dashed lines) of the total number of M. tuberculosis complex isolates and M. tuberculosis complex–infected herds identified in cattle during 2004–2009. Error bars indicate 95% confidence intervals.
1A list of members of The Spanish Network on Surveillance and Monitoring of Animal Tuberculosis can be found in the Technical Appendix (www.cdc.gov/EID/content/17/3/532-Techapp.pdf).
Page created: July 25, 2011
Page updated: July 25, 2011
Page reviewed: July 25, 2011
The conclusions, findings, and opinions expressed by authors contributing to this journal do not necessarily reflect the official position of the U.S. Department of Health and Human Services, the Public Health Service, the Centers for Disease Control and Prevention, or the authors' affiliated institutions. Use of trade names is for identification only and does not imply endorsement by any of the groups named above.