Serologic Surveillance of Anthrax in the Serengeti Ecosystem, Tanzania, 1996–2009
Tiziana Lembo, Katie Hampson

, Harriet Auty, Cari A. Beesley, Paul Bessell, Craig Packer, Jo Halliday, Robert D. Fyumagwa, Richard Hoare, Eblate Ernest, Christine Mentzel, Titus Mlengeya, Karen Stamey, Patricia P. Wilkins, and Sarah Cleaveland
Author affiliations: Author affiliations: University of Glasgow, Glasgow, Scotland (T. Lembo, K. Hampson, H. Auty, P. Bessell, S. Cleaveland); Lincoln Park Zoo, Chicago, Illinois, USA (T. Lembo); Centers for Disease Control and Prevention, Atlanta, Georgia, USA (C.A. Beesley, K. Stamey, P.P. Wilkins); University of Minnesota, St. Paul, Minnesota, USA (C. Packer); University of Edinburgh, Edinburgh, Scotland (J. Halliday); Tanzania Wildlife Research Institute, Arusha, Tanzania (R. Fyumagwa, R. Hoare, E. Ernest); Endangered Wildlife Trust, Parkview, South Africa (C. Mentzel); Tanzania National Parks, Arusha (T. Mlengeya)
Main Article
Figure 1
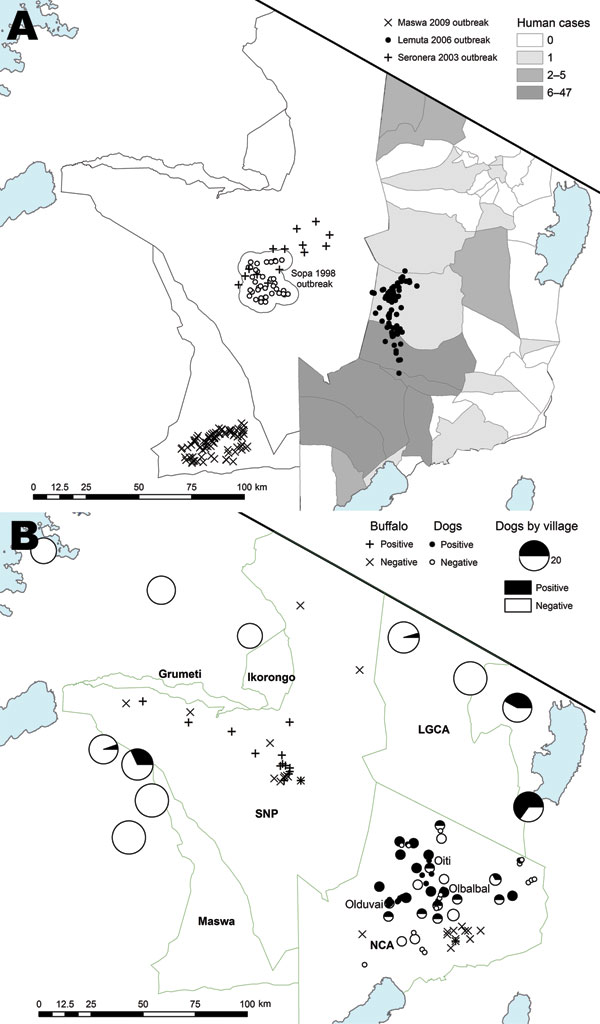
Figure 1. Anthrax cases and exposure to anthrax in the study area, Tanzania. Blue areas indicate lakes. A) Location of wildlife carcasses during anthrax outbreaks. Shaded areas indicate regions where human anthrax cases were reported during 1995–2008. Exact locations of carcasses obtained during the Sopa 1998 outbreak were not available; open circles indicate area where 549 probable cases and 67 suspected cases were detected. For the Seronera 2003 outbreak, locations of cases were randomized within a 10-km radius of the outbreak area because exact locations of carcasses were not available. B) Seroprevalence in domestic dog populations from sampled villages. Sample size is indicated by the radii of the pie charts. Green border indicates Serengeti ecosystem. LGCA, Loliondo Game Control Area; SNP, Serengeti National Park; NCA, Ngorongoro Conservation Area.
Main Article
Page created: July 25, 2011
Page updated: July 25, 2011
Page reviewed: July 25, 2011
The conclusions, findings, and opinions expressed by authors contributing to this journal do not necessarily reflect the official position of the U.S. Department of Health and Human Services, the Public Health Service, the Centers for Disease Control and Prevention, or the authors' affiliated institutions. Use of trade names is for identification only and does not imply endorsement by any of the groups named above.