Volume 17, Number 4—April 2011
Research
Complete Sequence and Molecular Epidemiology of IncK Epidemic Plasmid Encoding blaCTX-M-14
Jennifer L. Cottell, Mark A. Webber, Nick G. Coldham, Dafydd L. Taylor, Anna M. Cerdeño-Tárraga, Heidi Hauser, Nicholas R. Thomson, Martin J. Woodward, and Laura J.V. Piddock
Figure 2
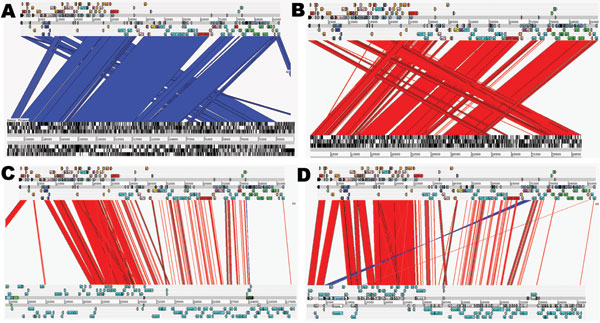
Figure 2. Artemis Comparison Tool (Sanger, Cambridge, UK) comparisons of IncK plasmid (pCT) with other plasmids. Complete DNA sequence plasmid comparisons. Bands of color indicate homology between sequences. Red lines show sequence in the same confirmation; blue lines indicate sequence inversion. The pCT sequence is represented as the top line of each comparison compared with pO26_vir (GenBank accession no. FJ38659) (A); R387 (B); R64 (accession no. AP005147) (C); and pEK204 (accession no. EU935740) (D) on each bottom line.
Page created: July 25, 2011
Page updated: July 25, 2011
Page reviewed: July 25, 2011
The conclusions, findings, and opinions expressed by authors contributing to this journal do not necessarily reflect the official position of the U.S. Department of Health and Human Services, the Public Health Service, the Centers for Disease Control and Prevention, or the authors' affiliated institutions. Use of trade names is for identification only and does not imply endorsement by any of the groups named above.