Volume 18, Number 10—October 2012
Letter
Pathogenic Leptospira spp. in Bats, Madagascar and Union of the Comoros
Erwan Lagadec1, Yann Gomard1, Vanina Guernier, Muriel Dietrich, Hervé Pascalis, Sarah Temmam, Beza Ramasindrazana, Steven M. Goodman, Pablo Tortosa , and Koussay Dellagi
Figure
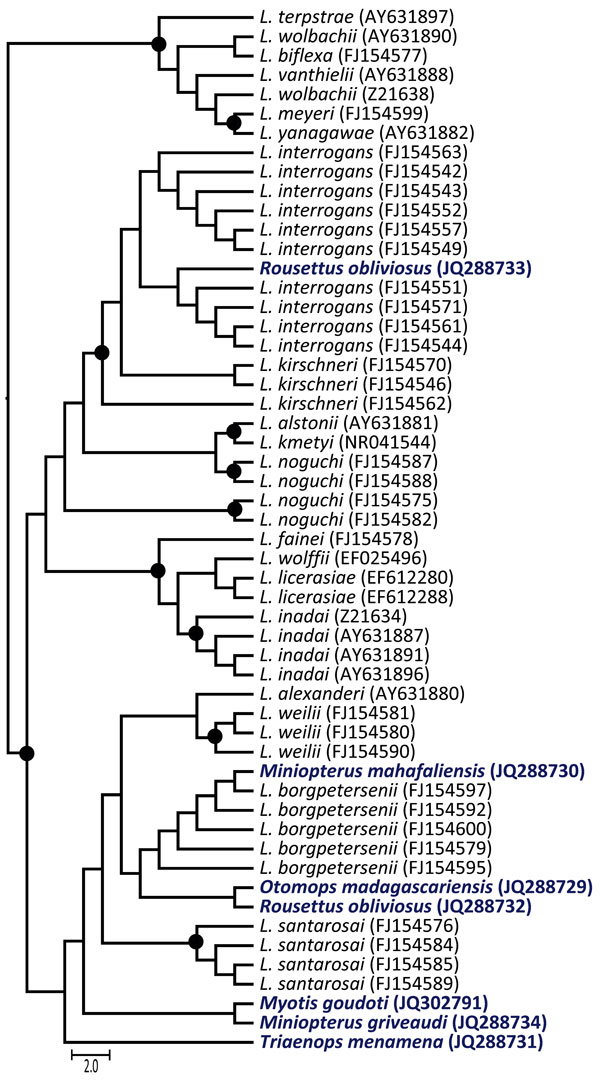
Figure. . . Maximum-likelihood phylogenetic tree of Leptospira spp.16s rDNA in bats from Madagascar and the Union of the Comoros. The dendrogram was constructed with a fragment of 641 bp, with the TIMef+I+G substitution model, and with 1,000 replications. Only bootstrap supports >70% are shown (circles). The precise geographic information of the sampled bats can be accessed through the GenBank accession numbers indicated in parentheses at branch tips. Host bat species for the sequences generated in this study are shown in boldface. Scale bar indicates number of nucleotide substitutions per site.
1These authors contributed equally to this article.
Page created: September 04, 2012
Page updated: September 04, 2012
Page reviewed: September 04, 2012
The conclusions, findings, and opinions expressed by authors contributing to this journal do not necessarily reflect the official position of the U.S. Department of Health and Human Services, the Public Health Service, the Centers for Disease Control and Prevention, or the authors' affiliated institutions. Use of trade names is for identification only and does not imply endorsement by any of the groups named above.