Volume 18, Number 8—August 2012
Research
Hepatitis E Virus Genotype 3 in Wild Rats, United States
Figure A1
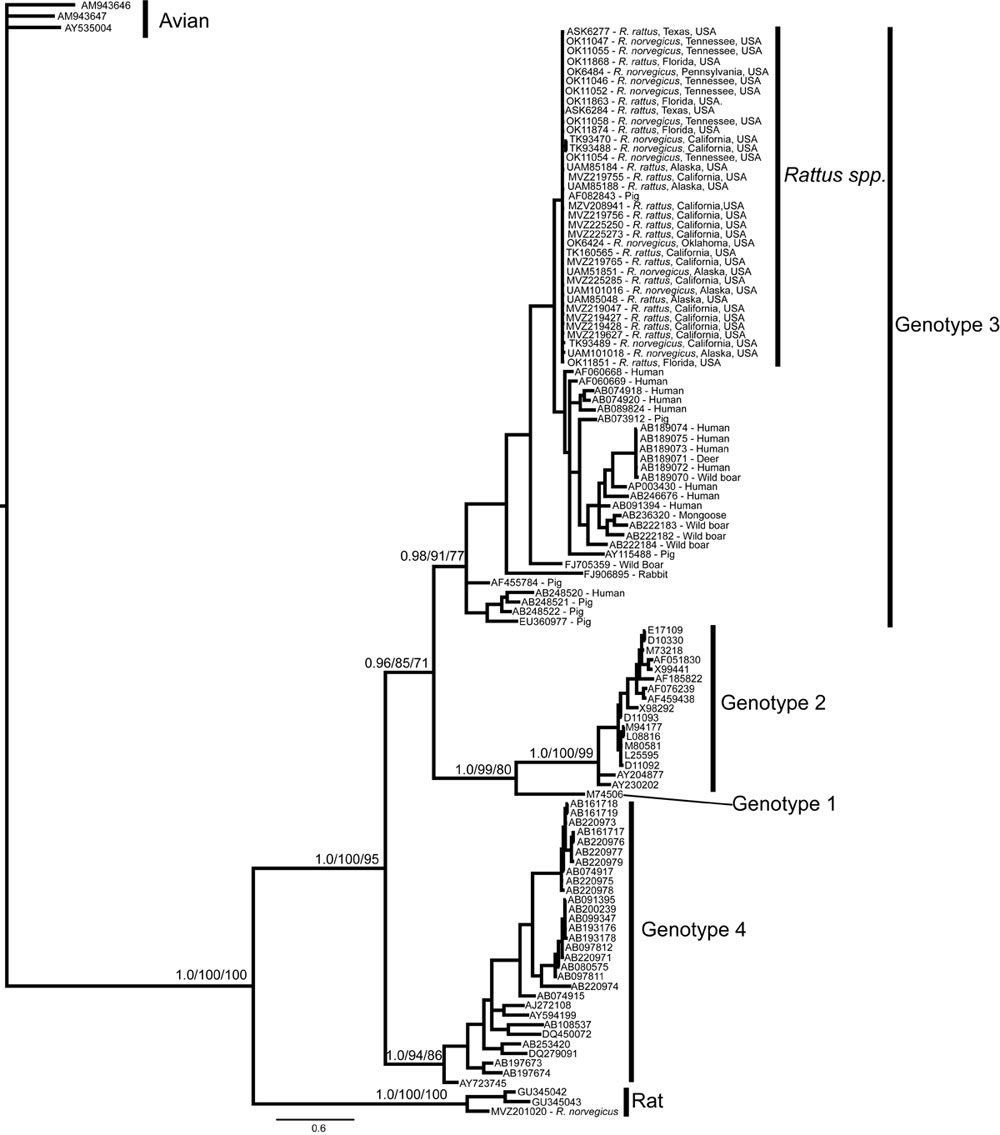
Figure A1. . . . Bayesian phylogram resulting from analysis of a 334-bp fragment of hepatitis E virus (HEV) open reading frame 1. Node labels represent Bayesian posterior probabilities/maximum-likelihood bootstrap/maximum-parsimony bootstrap values, respectively, and are given only for nodes at the base of each genotype and nodes uniting the genotypes. For sequences obtained in this study from isolates from wild rats collected in the United States, terminal taxa labels correspond to tissue accession numbers shown in the Technical Appendix, followed by the species from which the tissue originated and the source population. For all other HEV genotype 3 sequences, the GenBank accession number is given, followed by the species from which the viral RNA was isolated. For all other sequences included, only the GenBank accession number is given. Scale bar indicates nucleotide substitutions per site.