Volume 19, Number 4—April 2013
Research
Cost-effectiveness of Novel System of Mosquito Surveillance and Control, Brazil
Cite This Article
Citation for Media
Abstract
Of all countries in the Western Hemisphere, Brazil has the highest economic losses caused by dengue fever. We evaluated the cost-effectiveness of a novel system of vector surveillance and control, Monitoramento Inteligente da Dengue (Intelligent Dengue Monitoring System [MID]), which was implemented in 21 cities in Minas Gerais, Brazil. Traps for adult female mosquitoes were spaced at 300-m intervals throughout each city. In cities that used MID, vector control was conducted specifically at high-risk sites (indicated through daily updates by MID). In control cities, vector control proceeded according to guidelines of the Brazilian government. We estimated that MID prevented 27,191 cases of dengue fever and saved an average of $227 (median $58) per case prevented, which saved approximately $364,517 in direct costs (health care and vector control) and $7,138,940 in lost wages (societal effect) annually. MID was more effective in cities with stronger economies and more cost-effective in cities with higher levels of mosquito infestation.
Dengue viruses cause ≈50 million infections annually worldwide, and ≈1% of these infections require hospitalization because of dengue hemorrhagic fever (1). Brazil accounts for ≈75% of all dengue cases in the Western Hemisphere (2), and during 2000–2005, Brazil reported more cases than any other country in the world (3). Since the reemergence of dengue in Brazil in 1982, there has been an epidemiologic shift to hyperendemicity (4,5) and more severe disease (5,6). Moreover, of all countries in the Western Hemisphere, Brazil has the highest economic losses caused by dengue ($1.35 billion) annually for direct medical and nonmedical costs and indirect costs from loss of work (7). This high economic cost of the disease occurs even after Brazil spent $1 billion annually on the dengue vector control program. Cost-effective methods of vector control are needed to decrease the huge economic effects of this disease in Brazil.
The most accurate method of assessing dengue risk by vector surveillance is one that specifically counts dengue vectors that are actively in search of a blood meal: adult female Aedes aegypti and occasionally Ae. albopictus mosquitoes. Ttraditional methods of vector monitoring in Brazil, which include surveys of larvae and pupae (8,9) and capture of adult mosquitoes by aspiration (10), are less specific and labor-intensive. Surveys of larvae target both vector sexes and can only predict the number of mosquitoes that will survive to adulthood, rather than directly measure adults. Capturing adults by aspiration does not specifically target female mosquitoes, is labor-intensive, and requires access to premises.
Fixed-position traps designed to capture gravid mosquitoes (e.g., MosquiTRAPs) (Ecovec SA, Belo Horizonte, Brazil) have been developed to reduce personnel costs and directly measure adult female mosquito abundance in Brazil (11,12). MosquiTRAPs have been implemented in the form of a large-scale mosquito surveillance system, Monitoramento Inteligente da Dengue (Intelligent Dengue Monitoring System [MID]; Ecovec SA), which is used to count mosquitoes in real time. MID involves weekly monitoring of MosquiTRAP (placed in a 300 m × 300 m grid format) counts and trapped-mosquito infection status with automated database updating (in situ mosquito data entry by cell phones directly to a Web-based database). The mosquito data are managed by a spin-off company (Ecovec SA), which provides daily updates to control personnel so they can specifically target highly infested areas. Preliminary results from 3 cities (Tres Lagoas in Mato Grosso do Sul State, and Presidente Epitacio and Bastos in Sao Paulo State) during 1 season of MID implementation showed that this system is effective in decreasing dengue cases (13). However, an estimate of cost-effectiveness for more cities over a longer period is needed for deciding whether MID should be maintained.
We evaluated the cost-effectiveness of supplementing vector control methods with MID in 21 cities in Minas Gerais State, Brazil, after use during 2 dengue seasons. We also identified factors that affected efficacy and cost-effectiveness of MID. We reported direct savings for health care costs and vector control activities separately from indirect savings for lost wages so that results are relevant to public health budgets and societal concerns.
Case Data
Monthly dengue cases during January 2007–June 2011 were obtained from each municipality in Minas Gerais, Brazil, by using Sinan Net (Information System for Notification of Grievances), a publicly available database of the Health Ministry of Brazil. Dengue cases were expressed as incidence per 100,000 inhabitants on the basis of the Brazilian Institute of Geography and Statistics (Rio de Janeiro, Brazil) 2010 population census.
MID Mosquito Surveillance System
Figure 1
![Thumbnail of Spatial distribution of 21 cities tested with Monitoramento Inteligente da Dengue (Intelligent Dengue Monitoring System [MID]), Minas Gerais, Brazil, 2009–2011. A). Size of city centroids (n = 218) (circles) is proportional to population size. B) Size of city centroids (n = 147) (circles) is proportional to total dengue fever incidence during 2007–2011. Gray circles indicate cities that never implemented MID, and black circles indicate cities that implemented MID during mid-2009–Jun](/eid/images/12-0117-F1-tn.jpg)
Figure 1. . . Spatial distribution of 21 cities tested with Monitoramento Inteligente da Dengue (Intelligent Dengue Monitoring System [MID]), Minas Gerais, Brazil, 2009–2011. A). Size of city centroids (n = 218) (circles)...
MID was implemented in 21 cities in Minas Gerais during April 2009–June 2011. These cities are dispersed throughout the state in areas that included a range of population sizes and incidences (Figure 1). Cities that had the highest dengue incidence in the state were chosen by the Minas Gerais State Department of Health to receive MID. These cities were Aguas Formosas, Araguari, Bom Despacho, Caratinga, Conselheiro Lafaiete, Coronel Fabriciano, Curvelo, Governador Valadares, Ipatinga, Itabira, Joao Monlevade, Lavras, Malacacheta, Manhuaçu, Padre Paraiso, Paracatu, Pirapora, Ponte Nova, Sete Lagoas, Teofilo Otoni, and Visconde do Rio Branco. The only difference in vector-control activities between cities that used MID and those that did not use MID was that vector control in MID cities targeted sites that MID identified as highly infested with gravid adult mosquitoes. Details of the structure and function of MID and control efforts are shown in Technical Appendix 1.
Data Analysis
Figure 2
![Thumbnail of Changes in incidence of dengue fever in 21 cities that implemented Monitoramento Inteligente da Dengue (Intelligent Dengue Monitoring System [MID]), Minas Gerais, Brazil, mid-January 2007–June 2011. A) Annual incidence in 21 cities that implemented MID (bars outlined in black) and 147 cities that had not implemented MID (bars outlined in gray). Horizontal lines in boxplots indicate medians of 1,000 medians. Whiskers indicate ± 2.7 SD. Circles indicate points that fall outside ± 2.7](/eid/images/12-0117-F2-tn.jpg)
Figure 2. . . Changes in incidence of dengue fever in 21 cities that implemented Monitoramento Inteligente da Dengue (Intelligent Dengue Monitoring System [MID]), Minas Gerais, Brazil, mid-January 2007–June 2011. A) Annual incidence...
Dengue incidence was strongly seasonal, and outbreak probability varied substantially between cities (Figure 2, panel A), which did not follow any common statistical probability distribution in the exponential family. Thus, we adopted a nonparametric approach to data analysis. On the basis of potential differences in dengue transmission caused by population size (14) and demographics (15), the 21 treatment cities were divided into 5 groups by population size: 18,000–21,000, 35,000–60,000, 70,000–90,000, 100,000–140,000 and 150,000–300,000 for comparison with control cities (Figure 2, panel B). Cities within Minas Gerais that did not implement MID were referred to as control cities. There were 147 control cities that could be grouped into a distribution of population sizes of treatment cities.
To compare this large sample size in a case–control format to only 21 MID cities, we generated 1,000 random sets of 21 control cities with the same population distribution as the MID cities. Next, we calculated the relative difference in incidence (RI) for the same period before and after the start of surveillance for each treatment city (i.e., incidence for x time before MID/incidence for x time after MID). Likewise, for each set of the control cities, we calculated RI using the distribution of time frames in each group of treatment cities (Figure 2, panel C) matched to the corresponding group in control cities. Lastly, we calculated the median RI for each of the 1,000 sets of control cities and the set of treatment cities and calculated the difference (d = RIcontrol – RIMID). Under the null hypothesis that MID had no effect at decreasing RI, the median of the 1,000 differences would be 0. We tested this hypothesis using a sign test. The alternative hypothesis was that the median of the 1,000 differences would be significantly >0 if MID decreased the RI of treatment cities.
We identified factors that affected the effectiveness and cost-effectiveness of MID by using a generalized linear model (γ distribution, log link) with either RI or US dollars/prevented case as response variables. Factors considered were population size (PS); distance to 3 large populations (D3L); distance to 3 high-incidence populations; a ranking system for the effectiveness of using MID (PED); a measure of average mosquito infestation during the dengue season in 2011 (IMFA); population density; income per capita; and an index between 0 and 1 that included employment, income, education, and health, all with equal weight. Distances were the sum of Euclidian distance to 3 cities with population size (D3L) or density in the 90th percentile. We fit each variable individually and fit all possible linear combinations of the 8 variables.
We chose between competing models by using delta Akaike Information Criterion (ΔAIC = AIC of intercept only model – AIC of target model). A higher ΔAIC indicates a better model of the data. When comparing nested models that differed by only 1 factor, 2 AIC points is considered a significant difference (α = 0.05). Statistics for all single-variable models, model selection results, and fits of the best multivariable and full models are shown in of Technical Appendix 2 Tables 1, 2, and 3.
Figure 3
![Thumbnail of Effectiveness of Monitoramento Inteligente da Dengue (Intelligent Dengue Monitoring System [MID]), Minais Gerais, Brazil, mid-2009–mid 2011. Predicted number of dengue fever cases prevented per year during the time of MID are plotted against the annual incidence of dengue fever in each city during the same time. K is a percentage value of the population size in a city. Error bars indicate 2 SE. A) 29,533 cases were prevented when K = 50%. B) 24,263 cases were prevented when K = 20%.](/eid/images/12-0117-F3-tn.jpg)
Figure 3. . . Effectiveness of Monitoramento Inteligente da Dengue (Intelligent Dengue Monitoring System [MID]), Minais Gerais, Brazil, mid-2009–mid 2011. Predicted number of dengue fever cases prevented per year during the time of...
We estimated the number of cases prevented by MID by predicting the number of cases that would have occurred in the absence of MID and taking the difference between those and the number of observed cases (i.e., cases prevented/year = predicted cases in the absence of MID [E] – observed annual cases [O]). We calculated E by using a logistic model according to the equation Ei = diOi(1 – Oi/Ki), where K is the maximum number of possible cases in city i. The logic is that the number of cases prevented depends on the estimated growth coefficient (d = RIcontrol – RIMID) and the observed cases (O) but is capped by a theoretical maximum on the number of possible new cases (K). In the main text, we assumed that K was equal to 30% of the population in city i, which has been observed (16). However, we also considered higher and lower values of K (5%, 10%, 20%, and 50%) (Figure 3).
Cost Data
All costs were in US dollars. Costs per dengue case were taken from the report of Sheppard et al. (7). They calculated direct and indirect costs for ambulatory ($69 and $317, respectively) and hospitalized ($428 and $460, respectively) case-patients. We considered dengue fever case-patients to be ambulatory and dengue hemorrhagic fever case-patients, dengue shock syndrome case-patients, and case-patients who died to be hospitalized. We did not distinguish deaths (0.045% of case-patients) from severe cases (0.38% of case-patients) because we could not obtain the age distribution of deaths and gross domestic product estimates from each city. Indirect costs assumed an average of 4.5 days of lost work for ambulatory case-patients and 14 days for hospitalized case-patients (7). Estimates of indirect costs per case were adjusted to account for case-patients who did not miss work by using the age distribution of case-patients in Brazil (7).
Total costs for MID in the 21 cities were measured directly by Ecovec SA (Table). MID costs in individual cities varied from $25,566 to $163,944 (Technical Appendix 2 Table 4). Cost-effectiveness per city was calculated as the measured cost of MID in a given city divided by its number of cases prevented, as estimated from the model. In Minas Gerais, vector control activities are conducted according to guidelines of the National Program for Dengue Control (17) and the state department of health in Minas Gerais. Government resources are apportioned to cities on the basis of their population size and history of dengue incidence. Thus, we assumed that the per capita cost of control was similar in each treatment city. To estimate the cost of mosquito control activities in each city, we took the per capita cost ($1.11) from a study in Sao Paulo, Brazil, in 2005 (18) and multiplied this cost by the population size in each city. The previous study measured 3 components of dengue control costs: vector control activities (larval survey, insecticide spraying); laboratory activities (entomology and serologic analysis); and public education and database maintenance. Labor comprised ≈60% of costs, and materials needed for conducting the work comprised 31% of costs (18).
For each treatment city, we calculated the direct, indirect, and total costs of dengue. Direct costs comprised medical and nonmedical direct costs, as well as vector control and MID. Indirect costs comprised costs for lost wages and MID costs in treatment cities. Costs for MID cities were calculated from the number of observed cases (divided into ambulatory and hospitalized case-patients). Similarly, the estimated costs of dengue in the absence of MID were divided into ambulatory and hospitalized case-patients by multiplying the sum of the number of observed cases plus the number of prevented cases by the proportion of observed cases in persons who were ambulatory or hospitalized. The dollars saved annually were calculated by subtracting the cost of dengue in MID cities from the predicted cost of dengue if MID were not implemented. Underreporting was not accounted for because we had no city-specific data to inform estimates. Costs were not discounted because we considered all cases to be nonfatal and our study period was only 2.5 years.
Figure 4
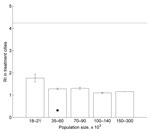
Figure 4. . . Mean relative difference in incidence (RI) of dengue fever cases for treatment cities grouped by population size using Monitoramento Inteligente da Dengue (Intelligent Dengue Monitoring System), Minas Gerais, Brazil,...
The annual incidence of dengue in control cities varied more widely than in treatment cities, and the median annual incidence in treatment cities was generally higher (Figure 2, panel A). However, there was a trend of decreased difference in incidence between annual incidence in treatment cities relative to control cities during the years (2010–2011) in which MID was used during the peak dengue season (January–May or June) (Figure 2, panel A). This trend was confirmed by the finding that the RI before and after the time frame of MID was 2.7× higher (a decrease from 4.0 in control cities to 1.3 in treatment cities; 68%), in control cities relative to those that used MID (z = −31.59, p<0.0001) (Figure 2, panel D). The RI for treatment cities for each population group is shown in Figure 4.
The most parsimonious generalized linear model of RI in MID cities included PS and IDFM (Technical Appendix 2 Table 2). PS and IDFM showed a negative correlation with RI, although the correlation of PS was marginally not significant (p = 0.083 for PS and p = 0.0023 for IDFM) (Technical Appendix 2 Table 3). This finding indicates that MID effectiveness was higher in cities with stronger economies and that there is a trend of higher effectiveness in larger populations. In contrast, the most parsimonious model of cost-effectiveness included IMFA and D3L (Technical Appendix 2 Table 2). IMFA and D3L showed a negative correlation with cost-effectiveness (p = 0.0086 and p = 0.032, respectively) (Technical Appendix 2 Table 3). Thus, cost-effectiveness was higher in cities with higher mosquito infestation levels and cities that were farther from cities with large populations.
Figure 5
![Thumbnail of Effectiveness of Monitoramento Inteligente da Dengue (Intelligent Dengue Monitoring System [MID]), Minas Gerais, Brazil, mid-2009–mid-2011. Predicted number of dengue fever cases prevented per year during the time of MID are plotted against the annual incidence of dengue fever cases in each city during the same time. A total of 27,191 cases were prevented. Cases prevented/year = predicted cases in the absence of MID (E) – observed annual cases (O), where Ei = diOi(1 – Oi/Ki), d is t](/eid/images/12-0117-F5-tn.jpg)
Figure 5. . . Effectiveness of Monitoramento Inteligente da Dengue (Intelligent Dengue Monitoring System [MID]), Minas Gerais, Brazil, mid-2009–mid-2011. Predicted number of dengue fever cases prevented per year during the time of MID...
Figure 6
![Thumbnail of Cost-effectiveness of and savings from Monitoramento Inteligente da Dengue (Intelligent Dengue Monitoring System [MID]), Minas Gerais, Brazil, mid-2009–mid-2011. A) For cost-effectiveness, the number of US dollars (USD$) spent per dengue fever case prevented is plotted against the annual incidence of dengue fever cases during MID for the city. Each point represents cost-effectiveness for a city. Points are coded by population size classes. Horizontal line indicates average cost-effe](/eid/images/12-0117-F6-tn.jpg)
Figure 6. . . Cost-effectiveness of and savings from Monitoramento Inteligente da Dengue (Intelligent Dengue Monitoring System [MID]), Minas Gerais, Brazil, mid-2009–mid-2011. A) For cost-effectiveness, the number of US dollars (USD$) spent per...
Under the assumption that dengue could affect 30% of a population, we estimated that the number of cases prevented by MID annually in the largest cities (>130,000 inhabitants) was 2,300–3,900 (Figure 5). In the smallest cities (<40,000 inhabitants), these estimates decreased to 143–182, and the total number in all 21 cities was 27,191. However, these numbers depend on the assumed number of potentially susceptible persons (Figure 3). The average cost-effectiveness was $227/case prevented, which was driven mainly by a few larger values (Figure 6, panel A). The median value was $58, indicating that the average value was higher than the cost-effectiveness value in most cities. The number of cases prevented translated to net total savings of $8,999,406 annually. Savings in health care and vector control costs was $364,517, and savings in lost wages was $7,138,940 (Figure 6, panel B; Technical Appendix 2 Table 4).
Accurate estimates of dengue incidence and its economic effects are more limited (16,19) than are estimates of other infectious diseases that pose similarly serious public health threats. This finding is caused mainly by high variability in clinical disease, high underreporting rates, and lack of studies that directly measure the efficacy of controls. Consequently, only a few studies have demonstrated the cost-effectiveness of vector control activities (19–21). In one of these studies, targeted source reduction was more effective than nontargeted vector control, reducing vector abundance by 52%–82% depending on the country (21). Another study found that targeted vector control reduced the dengue case load by 53% (20). Our estimate of a 68% reduction in incidence caused by targeted control efforts by MID was higher than that in the study by Suaya et al. (20). One reason may be geographic differences in the effects of source reduction methods (the previous study was conducted in Cambodia). Alternatively, our higher estimate may be caused by implementation of MID at a fine spatial scale over a broader area, which produced higher intervention efficacy.
The trend of increased effectiveness in larger populations might not be significant in the multivariable model (which includes IDFM) because PS and IDFM showed a positive correlation (r = 0.53). The single-variable model results suggest that MID may be more effective in larger populations (Technical Appendix 2 Table 1). The fact that MID was more cost-effective in cities with higher mosquito infestation levels emphasizes the power of targeting vector control practices to areas in which gravid mosquitoes are most abundant. A possible reason for higher cost-effectiveness in cities that were farther from large cities could be that proximity to larger cities may enable a higher proportion of cases that were contracted elsewhere (i.e., during travel or commuting to large metropolitan areas) (22,23).
PED, a measure of MID quality, was not correlated with effectiveness or cost-effectiveness of MID. This result suggests that variation in the force of infection between cities overwhelmed differences in PED, the current measure of PED is inaccurate, or both. The relationship between mosquito infestation and human incidence is highly variable in space and time (24–26). Studies of dengue virus serotype circulation in Brazil have found dominance of a single serotype during any given year, and different genotypes within the serotypic groups have caused large, severe outbreaks because of reduced population immunity (5,27–29). Thus, variations between cities in novel genotype dynamics might have affected variation in RI because of PED. In addition, PED pertains only to MID activities and does not evaluate control activities. It is likely that the quality with which cities conduct prescribed control practices varies, which could also explain the lack of relationship between PED and RI. Furthermore, PED is assessed by a yes or no checklist for MID activities, rather than by an evaluation of the quality of each activity. If only minor activities constitute most of the variation in PED, then little meaningful variation in MID quality between cities might be observed. Regardless, the lack of relationship between PED and efficacy of MID suggests that an additional method for assessing MID quality, perhaps through collaboration with city control personnel, might be useful for maintaining, standardizing, and improving quality.
One caveat to our method of estimating cost-effectiveness is that it was necessary to estimate the number of susceptible hosts in the absence of MID (we used 30%) to predict the number of cases that would be prevented. Although 30% is not unreasonable based on previous studies (16), the maximum incidence observed in a given city in Minas Gerais during 2007–2010 was only 8.8%. This discrepancy was partly caused by underreporting, which was not accounted for in our study. Nevertheless, we also provided predictions for lower values of K to understand how it could affect our estimates. When fewer hosts are susceptible, the number of cases prevented is also lower, which decreases the cost-effectiveness of MID. Thus, previous large outbreaks with the same serotype and vaccination programs would be expected to decrease the cost-effectiveness of MID. Another caveat to our assumption is that K varies by city because of historical disease patterns and other factors. Collection of longitudinal serologic data would be useful for more accurate, city-specific predictions of K. Last, our study used previously estimated costs for control activities, health care, and lost wages. These costs were per capita estimates that we assumed could be extrapolated to each city equally. The accuracy of our results could be improved through microcosting analyses within each city.
Although MID showed an average cost-effectiveness value of $227 (median $58) per case prevented in Minas Gerais, the average value increased to $616 in 6 moderately sized cities (population 73,000–117,000) that did not show any savings in direct costs (Technical Appendix 2 Table 4). Three of the cities saved on indirect costs and total costs, but the 3 other cities (Joao Monlevade, Itabira, and Conselheiro Lafeite) had a net loss of up to $81,042 in direct costs and $66,246 in indirect costs because of incorporating MID into their budgets. These 3 cities had relatively low annual dengue incidence in the 2 years before MID implementation (12, 18, and 72 cases per 100,000 population relative to a range of 104–2,014 cases in the other 18 cities except for Paracatu, which had 4 cases). Thus, in general, cities with annual incidences of >72 cases per year were more likely to have higher MID cost-effectiveness.
Furthermore, cities in which MID was implemented had historically high dengue incidences relative to control cities (mean ± SD 2007 and 2008 were 549.1 ± 592 in MID cities and 240.4 ± 567.6 in control cities). Thus, average estimates of cost-effectiveness may be high in cities in which MID was implemented. However, factors determining incidence patterns in a given city, such as population immunity, infrastructure, or human behavior, may not be static over time because high population immunity is not protective against novel serotypes (or genotypes with high forces of infection) and human behavior and infrastructure are continually changing. A predictive model of serotype dynamics across cities formulated on the basis of serologic data would be useful for decisions on which cities should implement MID so that the most cost-effective strategy can be achieved statewide.
Our study showed that MID is generally effective for decreasing case loads and suggested that an MID strategy is theoretically better than other strategies. Although MID cost-effectiveness varied between cities, implementation of MID saved hundreds of thousands of dollars on health care and ≈7 million dollars in lost wages statewide, and half the cities had cost-effectiveness values <$58. Furthermore, these numbers are underestimates because our study did not account for underreporting or additional costs from deaths. Investing more effort into integrating MID strategies and costs with vector control operations, and standardizing the MID-based control system across cities, should help to increase MID cost-effectiveness.
Dr Pepin is an epidemiologist at Colorado State University in Fort Collins, Colorado. Her research interests are epidemiologic modeling and statistical analyses of infectious disease data to facilitate decision making for public health practices.
Acknowledgment
K.M.P. was supported by the Research and Policy for Infectious Disease Dynamics Program of the Science and Technology Directorate, US Department of Homeland Security; and the Fogarty International Center, National Institutes of Health. A.E.E. was supported by Conselho Nacional de Desenvolvimento Científico e Tecnológico (PRONEX-Dengue), Fundação de Amparo à Pesquisa do Estado de Minas Gerais, Departamento de Ciência e Tecnologia–Ministério da Saúde, and Instituto Nacional de Ciência e Tecnologia–Dengue.
References
- Guzman MG, Halstead SB, Artsob H, Buchy P, Jeremy F, Gubler DJ, Dengue: a continuing global threat. Nat Rev Microbiol. 2010;8(Suppl):S7–16. DOIPubMedGoogle Scholar
- Nogueira RM, de Araujo JM, Schatzmayri HG. Dengue viruses in Brazil, 1986–2006. Rev Panam Salud Publica. 2007;22:358–63. DOIPubMedGoogle Scholar
- Teixeira MG, Costa MD, Barreto F, Barreto ML. Dengue: twenty-five years since reemergence in Brazil. Cad Saude Publica. 2009;25:S7–18. DOIPubMedGoogle Scholar
- Rodriguez-Barraquer I, Cordeiro MT, Braga C, de Souza WV, Marques ET, Cummings DA. From re-emergence to hyperendemicity: the natural history of the dengue epidemic in Brazil. PLoS Negl Trop Dis. 2011;5:e935. DOIPubMedGoogle Scholar
- Figueiredo LT. Dengue in Brazil during 1999–2009: a review. Dengue Bull. 2010;34:6–12.
- San Martín JL, Brathwaite O, Zambrano B, Solorzano JO, Bouckenooghe A, Dayan GH, The epidemiology of dengue in the Americas over the last three decades: a worrisome reality. Am J Trop Med Hyg. 2010;82:128–35. DOIPubMedGoogle Scholar
- Shepard DS, Coudeville L, Halasa YA, Zambrano B, Dayan GH. Economic impact of dengue illness in the Americas. Am J Trop Med Hyg. 2011;84:200–7. DOIPubMedGoogle Scholar
- Pilger D, Lenhart A, Manrique-Saide P, Siqueira JB, da Rocha WT, Kroeger A. Is routine dengue vector surveillance in central Brazil able to accurately monitor the Aedes aegypti population? Results from a pupal productivity survey. Trop Med Int Health. 2011;16:1143–50. DOIPubMedGoogle Scholar
- Steffler LM, Marteis LS, Dolabella SS, Cavalcanti SC, dos Santos RL. Risk of dengue occurrence based on the capture of gravid Aedes aegypti females using MosquiTRAP. Mem Inst Oswaldo Cruz. 2011;106:365–7 .PubMedGoogle Scholar
- Maciel-de-Freitas R, Eiras AE, Lourenco-de-Oliveira R. Calculating the survival rate and estimated population density of gravid Aedes aegypti (Diptera, Culicidae) in Rio de Janeiro, Brazil. Cad Saude Publica. 2008;24:2747–54. DOIPubMedGoogle Scholar
- Honório NA, Codeco CT, Alvis FC, Magalhaes MA, Lourenco-de-Oliveira R. Temporal distribution of Aedes aegypti in different districts of Rio De Janeiro, Brazil, measured by two types of traps. J Med Entomol. 2009;46:1001–14. DOIPubMedGoogle Scholar
- Maciel-de-Freitas R, Peres RC, Alves F, Brandolini MB. Mosquito traps designed to capture Aedes aegypti (Diptera: Culicidae) females: preliminary comparison of Adultrap, MosquiTRAP and backpack aspirator efficiency in a dengue-endemic area of Brazil. Mem Inst Oswaldo Cruz. 2008;103:602–5. DOIPubMedGoogle Scholar
- Eiras AE, Resende MC. Preliminary evaluation of the “Dengue-MI” technology for Aedes aegypti monitoring and control. Cad Saude Publica. 2009;25:S45–58. DOIPubMedGoogle Scholar
- de Castro Medeiros LC, Castilho CA, Braga C, de Souza WV, Regis L, Monteiro AM. Modeling the dynamic transmission of dengue fever: investigating disease persistence. PLoS Negl Trop Dis. 2011;5:e942. DOIPubMedGoogle Scholar
- Esteva L, Vargas C. A model for dengue disease with variable human population. J Math Biol. 1999;38:220–40 and. DOIPubMedGoogle Scholar
- Endy TP, Yoon IK, Mammen MP. Prospective cohort studies of dengue viral transmission and severity of disease. Curr Top Microbiol Immunol. 2010;338:1–13. DOIPubMedGoogle Scholar
- Ministério da Saúde Brasil. Diretrizes nacionais para a prevenção e controle de epidemias de dengue. Brasilia (Brazil): O Ministério; 2009.
- Taliberti H, Zucchi P. Direct costs of the dengue fever control and prevention program in 2005 in the City of Sao Paulo. Rev Panam Salud Publica. 2010;27:175–80. DOIPubMedGoogle Scholar
- Beatty ME, Beutels P, Meltzer MI, Shepard DS, Hombach J, Hutubessy R, Health economics of dengue: a systematic literature review and expert panel’s assessment. Am J Trop Med Hyg. 2011;84:473–88. DOIPubMedGoogle Scholar
- Suaya JA, Shepard DS, Chang MS, Caram M, Hoyer S, Socheat D, Cost-effectiveness of annual targeted larviciding campaigns in Cambodia against the dengue vector Aedes aegypti. Trop Med Int Health. 2007;12:1026–36. DOIPubMedGoogle Scholar
- Tun-Lin W, Lenhart A, Nam VS, Rebollar-Tellez E, Morrison AC, Barbazan P, Reducing costs and operational constraints of dengue vector control by targeting productive breeding places: a multi-country non-inferiority cluster randomized trial. Trop Med Int Health. 2009;14:1143–53. DOIPubMedGoogle Scholar
- Grenfell BT, Bjornstad ON, Finkenstadt BF. Dynamics of measles epidemics: scaling noise, determinism, and predictability with the TSIR model. Ecol Monogr. 2002;72:185–202. DOIGoogle Scholar
- Xia Y, Bjornstad ON, Grenfell BT. Measles metapopulation dynamics: a gravity model for epidemiological coupling and dynamics. Am Nat. 2004;164:267–81. DOIPubMedGoogle Scholar
- Dibo MR, Chierotti AP, Ferrari MS, Mendonca AL, Neto FC. Study of the relationship between Aedes (Stegomyia) aegypti egg and adult densities, dengue fever and climate in Mirassol, state of Sao Paulo, Brazil. Mem Inst Oswaldo Cruz. 2008;103:554–60 and. DOIPubMedGoogle Scholar
- Honório NA, Nogueira RM, Codeco CT, Carvalho MS, Cruz OG, Magalhaes MD, Spatial evaluation and modeling of dengue seroprevalence and vector density in Rio de Janeiro, Brazil. PLoS Negl Trop Dis. 2009;3:e545 .PubMedGoogle Scholar
- Lin CH, Wen TH. Using geographically weighted regression (GWR) to explore spatial varying relationships of immature mosquitoes and human densities with the incidence of dengue. Int J Environ Res Public Health. 2011;8:2798–815. DOIPubMedGoogle Scholar
- dos Santos FB, Nogueira FB, Castro MG, Nunes PC, de Filippis AM, Faria NR, First report of multiple lineages of dengue viruses type 1 in Rio de Janeiro, Brazil. Virol J. 2011;8:387. DOIPubMedGoogle Scholar
- Oliveira MF, Araujo JM, Ferreira OC, Ferreira DF, Lima DB, Santos FB, Two lineages of dengue virus type 2, Brazil. Emerg Infect Dis. 2010;16:576–8. DOIPubMedGoogle Scholar
- Romano CM, de Matos AM, Araujo ES, Villas-Boas LS, da Silva WC, Oliveira OM, Characterization of dengue virus type 2: new insights on the 2010 Brazilian epidemic. PLoS ONE. 2010;5:e11811. DOIPubMedGoogle Scholar
Figures
Table
Cite This ArticleTable of Contents – Volume 19, Number 4—April 2013
| EID Search Options |
|---|
|
|
|
|
|
|
Please use the form below to submit correspondence to the authors or contact them at the following address:
Alvaro E. Eiras, Chemical Ecology of Insect Vector Laboratory, Federal University of Minas Gerais, Belo Horizonte, Minas Gerais, Brazil
Top