Volume 19, Number 6—June 2013
Research
Spatiotemporal Dynamics of Dengue Epidemics, Southern Vietnam
Hoang Quoc Cuong, Nguyen Thanh Vu, Bernard Cazelles, Maciej F. Boni, Khoa T.D. Thai, Maia A. Rabaa, Luong Chan Quang, Cameron P. Simmons, Tran Ngoc Huu, and Katherine L. Anders
Figure 6
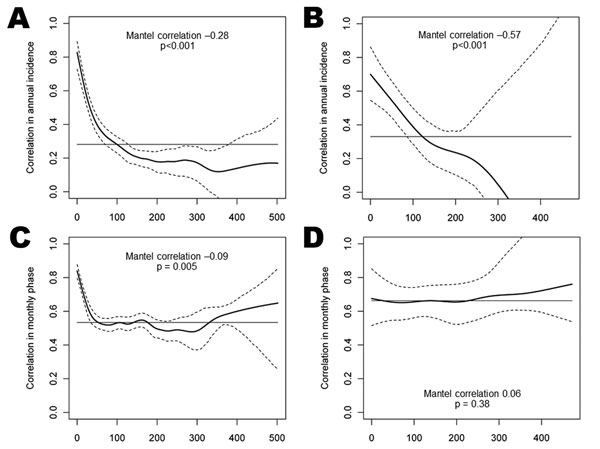
Figure 6. . Spatial coherence in the magnitude (A and B) and timing (C and D) of dengue epidemics in southern Vietnam. District data are shown in panels A and C, and province data in panels B and D. Solid lines represent the correlation between provinces/districts as a function of the distance between the centroids of those provinces/districts, in kilometers. Dashed lines represent 95% CIs, and the horizontal line is the overall correlation across southern Vietnam. Coherence in the magnitude and timing of epidemics was measured by pairwise correlation between provinces/districts in their standardized square root–transformed annual incidence and monthly phase series, respectively.
Page created: May 20, 2013
Page updated: May 20, 2013
Page reviewed: May 20, 2013
The conclusions, findings, and opinions expressed by authors contributing to this journal do not necessarily reflect the official position of the U.S. Department of Health and Human Services, the Public Health Service, the Centers for Disease Control and Prevention, or the authors' affiliated institutions. Use of trade names is for identification only and does not imply endorsement by any of the groups named above.