Volume 20, Number 4—April 2014
Research
High Rates of Antimicrobial Drug Resistance Gene Acquisition after International Travel, the Netherlands
Christian J.H. von Wintersdorff, John Penders, Ellen E. Stobberingh, Astrid M.L. Oude Lashof, Christian J.P.A. Hoebe, Paul H.M. Savelkoul, and Petra F.G. Wolffs
Figure 2
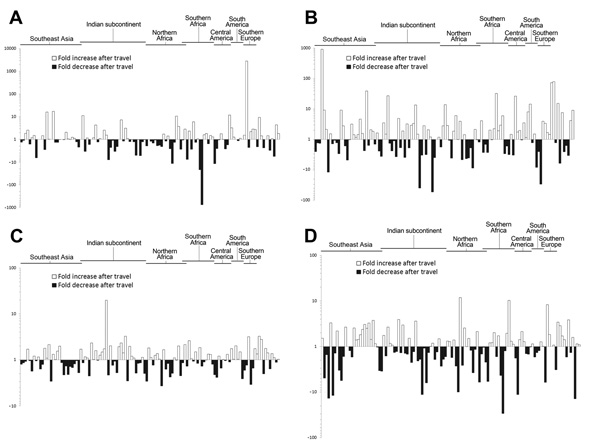
Figure 2. . . Relative changes in gene abundance before and after travel for each of 122 healthy travelers from the Netherlands during 2010–2012 for genes cfxA (A), tetM (B), tetQ (C), and ermB (D). Increases are shown with white bars on the positive y-axis; decreases are shown in dark gray bars on the negative y-axis. Each bar on the x-axis represents the change in a different study participant. The travel destination regions of the participants are indicated above the graph. No region is indicated for some travelers who either visited >1 of these regions or visited countries that were not in the defined regions (see Table 2).
*These authors contributed equally to this article and are co–first authors.
Page created: March 12, 2014
Page updated: March 12, 2014
Page reviewed: March 12, 2014
The conclusions, findings, and opinions expressed by authors contributing to this journal do not necessarily reflect the official position of the U.S. Department of Health and Human Services, the Public Health Service, the Centers for Disease Control and Prevention, or the authors' affiliated institutions. Use of trade names is for identification only and does not imply endorsement by any of the groups named above.