Volume 21, Number 10—October 2015
Dispatch
Spatiotemporal Patterns of Schistosomiasis-Related Deaths, Brazil, 2000–2011
Francisco Rogerlândio Martins-Melo, Marta Cristhiany Cunha Pinheiro, Alberto Novaes Ramos, Carlos Henrique Alencar, Fernando Schemelzer de Moraes Bezerra, and Jorg Heukelbach
Figure 2
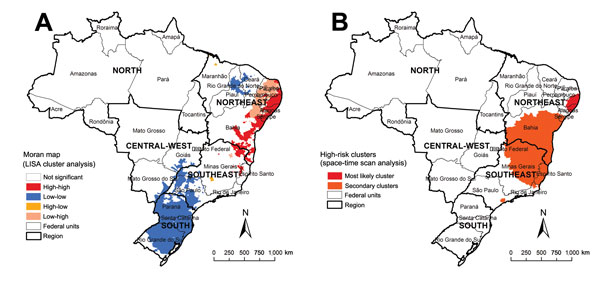
Figure 2. Spatial and spatiotemporal cluster analysis of rates of schistosomiasis-related deaths, by municipality of residence, Brazil, 2000–2011. A) LISA cluster analysis (Moran Map), based on Local Moran’s I index. B) Scan space-time clusters analysis, calculated by using Kulldorff’s scan statistics with SaTScan software version 9.1.1 (Harvard Medical School, Boston, MA, USA; Information Management Service, Silver Spring, MD, USA). Mapping and calculation of autocorrelation spatial analysis were conducted using ArcGIS software version 9.3 (Esri, Redlands, CA, USA). LISA, Local Index of Spatial Association.
Page created: September 22, 2015
Page updated: September 22, 2015
Page reviewed: September 22, 2015
The conclusions, findings, and opinions expressed by authors contributing to this journal do not necessarily reflect the official position of the U.S. Department of Health and Human Services, the Public Health Service, the Centers for Disease Control and Prevention, or the authors' affiliated institutions. Use of trade names is for identification only and does not imply endorsement by any of the groups named above.