Volume 21, Number 11—November 2015
Research
USA300 Methicillin-Resistant Staphylococcus aureus, United States, 2000–2013
Figure 2
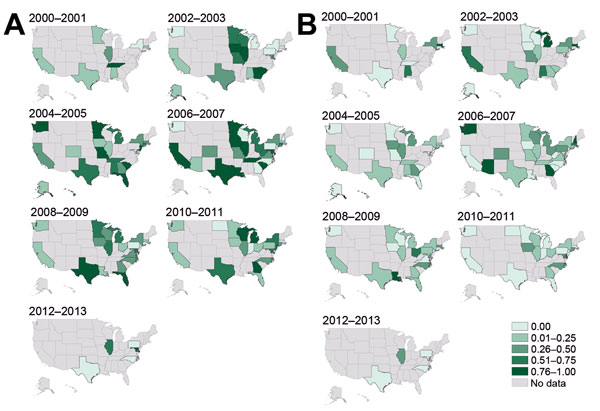
Figure 2. Proportions of methicillin-resistant Staphylococcus aureus isolates, United States 2000–2013. A) USA300 strain type. B) USA100 strain type. Darker shading indicates higher proportions of types reported in studies conducted during those years.
1These authors contributed equally to this article.
Page created: October 16, 2015
Page updated: October 16, 2015
Page reviewed: October 16, 2015
The conclusions, findings, and opinions expressed by authors contributing to this journal do not necessarily reflect the official position of the U.S. Department of Health and Human Services, the Public Health Service, the Centers for Disease Control and Prevention, or the authors' affiliated institutions. Use of trade names is for identification only and does not imply endorsement by any of the groups named above.