Skip directly to site content Skip directly to page options Skip directly to A-Z link Skip directly to A-Z link Skip directly to A-Z link
Volume 21, Number 11—November 2015
Research

Carbapenem-Resistant Enterobacteriaceae in Children, United States, 1999–2012

Latania K. LoganComments to Author , John P. Renschler, Sumanth Gandra, Robert A. Weinstein, Ramanan Laxminarayan, and for the Centers for Disease Control and Prevention Epicenters Program
Author affiliations: Rush University Medical Center, Chicago, Illinois, USA (L.K. Logan, R.A. Weinstein); John H. Stroger, Jr. Hospital of Cook County, Chicago (L.K. Logan, R.A. Weinstein); Center for Disease Dynamics, Economics and Policy, Washington, DC, USA (J.P. Renschler, S. Gandra, R. Laxminarayan); Public Health Foundation of India, New Delhi, India (R. Laxminarayan); Princeton University, Princeton, New Jersey, USA (R. Laxminarayan)

Main Article

Figure 3

Regional trends in the prevalence of carbapenem-resistant Enterobacteriaceae (CRE) isolates from children, The Surveillance Network−USA database, 1999–2012. A) Percentage of isolates with CRE phenotype, 1999–2006 (0%). The 6 regions shown correspond to the 4 US Census regions (West, Northeast, South, Midwest). However, the Midwest and South regions, respectively, were split into East and West North Central and South Central and South Atlantic. Isolates from Alaska and Hawaii are included in the

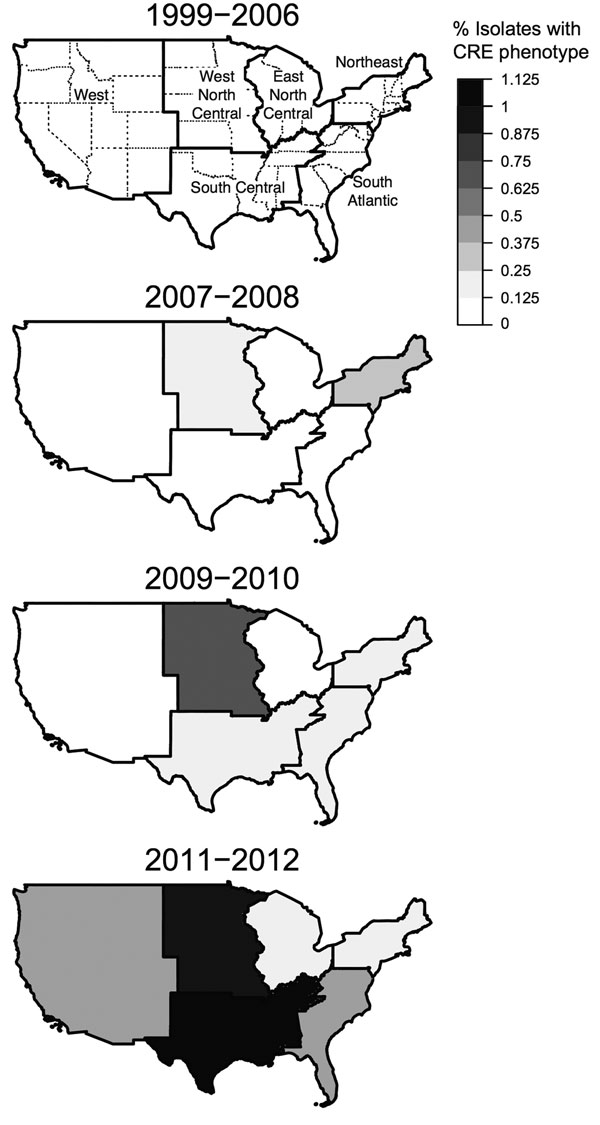
Figure 3. Regional trends in the prevalence of carbapenem-resistant Enterobacteriaceae (CRE) isolates from children, The Surveillance Network−USA database, 1999–2012. A) Percentage of isolates with CRE phenotype, 1999–2006 (0%). The 6 regions shown correspond to the 4 US Census regions (West, Northeast, South, Midwest). However, the Midwest and South regions, respectively, were split into East and West North Central and South Central and South Atlantic. Isolates from Alaska and Hawaii are included in the West region. B–D) Percentage of isolates with CRE phenotype, by 2-year period, 2007–2012. There was a significant positive quadratic trend for West (p = 4.1 × 10⁻¹⁵), South Atlantic (p = 9.4 × 10⁻¹²), East North Central (p = 0.0002), South Central (p = 5.2 × 10⁻¹⁷), and West North Central (p = 7.2 × 10⁻⁸). There was a significant linear trend for North East (p = 5.8 × 10⁻⁸). Data for patients <1 year of age were not available for all years and were excluded from this analysis.

Main Article

Page created: October 29, 2015
Page updated: October 29, 2015
Page reviewed: October 29, 2015
The conclusions, findings, and opinions expressed by authors contributing to this journal do not necessarily reflect the official position of the U.S. Department of Health and Human Services, the Public Health Service, the Centers for Disease Control and Prevention, or the authors' affiliated institutions. Use of trade names is for identification only and does not imply endorsement by any of the groups named above.
file_external