Volume 21, Number 9—September 2015
THEME ISSUE
Emerging Infections Program
Emerging Infections Program
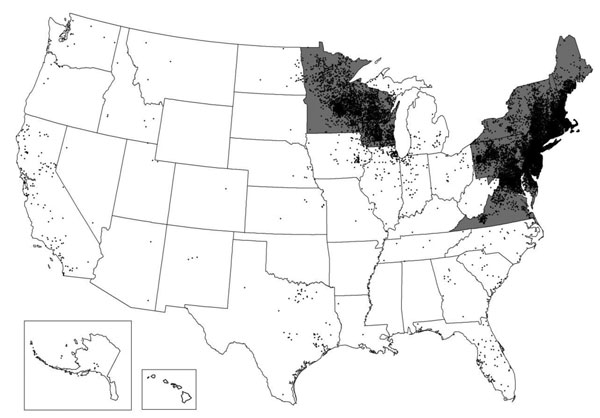
Incidence of Clinician-Diagnosed Lyme Disease, United States, 2005–2010
Figure 5

Figure 5. Comparison of states and district with highest incidence per 100,000 persons of Lyme disease in MarketScan (gray fill) and US surveillance (black dots), 2005–2010. Each dot is placed randomly within the county of residence for each confirmed Lyme disease case reported through surveillance during 2010.
Page created: August 12, 2015
Page updated: August 12, 2015
Page reviewed: August 12, 2015
The conclusions, findings, and opinions expressed by authors contributing to this journal do not necessarily reflect the official position of the U.S. Department of Health and Human Services, the Public Health Service, the Centers for Disease Control and Prevention, or the authors' affiliated institutions. Use of trade names is for identification only and does not imply endorsement by any of the groups named above.