Volume 22, Number 11—November 2016
Dispatch
Imported Chikungunya Virus Strains, Taiwan, 2006–2014
Figure
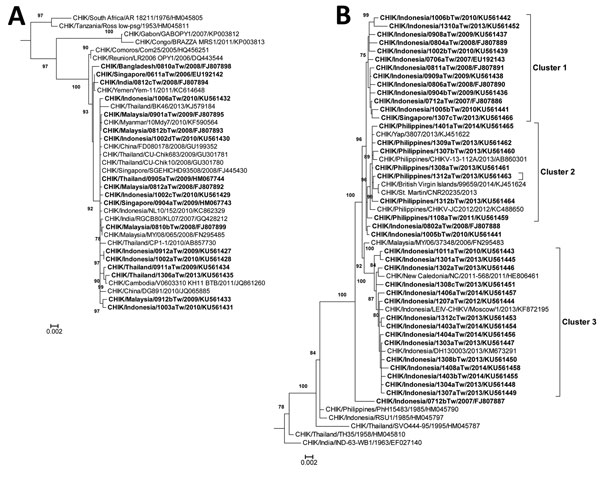
Figure. Phylogenetic analysis of chikungunya virus (CHIKV) isolates from imported cases of chikungunya in Taiwan, 2006–2014. Trees show genetic relationships of the Asian genotype (A) and East/Central/South African genotype (B) of CHIKV isolates; clusters are shown in (B). Trees were generated by using nucleotide sequences (3,747 bp) of complete structural protein genes C-E3-E2-6K-E1 (capsid–envelope–6K) of CHIKV strains. Sequences obtained in this study are indicated in bold. Viruses are identified by virus/country/strain/year of isolation/GenBank accession no. Strains reported in this study were submitted to GenBank under accession nos. FJ807886–FJ807895, FJ807898, FJ807899, EU192142, EU192143, HM067743, HM067744, and KU561427–KU561466. Analysis was performed by using MEGA version 6 software (http://www.megasoftware.net/) and the maximal-likelihood method (general time-reversible model). Bootstrap support values >75 are shown (1,000 replicates) along branches. Scale bars indicate nucleotide substitutions per site.