Volume 22, Number 11—November 2016
Dispatch
Severe Fever with Thrombocytopenia Syndrome Complicated by Co-infection with Spotted Fever Group Rickettsiae, China
Figure 2
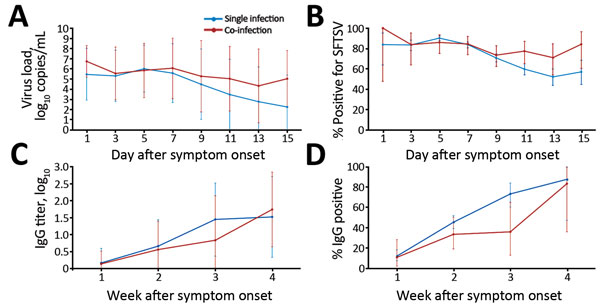
Figure 2. Dynamic profiles for severe fever with thrombocytopenia syndrome virus (SFTSV) RNA and SFTSV-specific IgG in hospitalized patients with SFTSV infection only or with SFTSV and spotted fever group rickettsiae co-infection, China, 2013–2015. A) log10-transformed SFTSV virus loads. B) Percentage of patients positive for SFTSV. C) log10-transformed SFTSV IgG titers. D) Percentage of patients positive for SFTSV IgG. Comparisons were performed using the generalized estimating equation model. The error bars, which show the standard deviation for log10-transformed SFTSV virus loads and log10-transformed SFTSV IgG titers, represent the 95% CI for the percentage of patients positive for SFTSV and SFTSV IgG.
1These authors contributed equally to this article.