Volume 22, Number 7—July 2016
Research
Heat Wave–Associated Vibriosis, Sweden and Finland, 2014
Figure 3

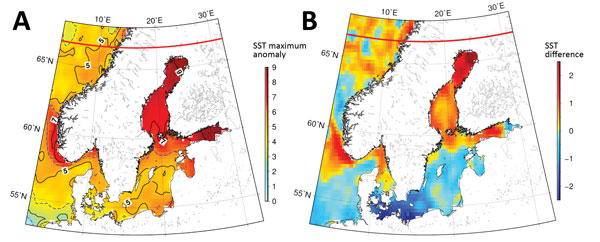
Figure 3. SST anomaly data for coastal areas of Sweden and Finland. A) Maximum SST anomalies during July and August 2014. The anomalies were substantially high throughout the region but especially in the northern Baltic Sea area. B) Differences between the maximum temperatures during 2014 and those during 1982–2013. SST, sea surface temperature.
Page created: June 14, 2016
Page updated: June 14, 2016
Page reviewed: June 14, 2016
The conclusions, findings, and opinions expressed by authors contributing to this journal do not necessarily reflect the official position of the U.S. Department of Health and Human Services, the Public Health Service, the Centers for Disease Control and Prevention, or the authors' affiliated institutions. Use of trade names is for identification only and does not imply endorsement by any of the groups named above.