Rare Human Infection with Pacific Broad Tapeworm Adenocephalus pacificus, Australia
Casey V. Moore, R.C. Andrew Thompson, Abdul Jabbar, John V. Williams, Kavita Rasiah, Louise Pallant, Ann P. Koehler, Caitlin Graham, and Gerhard F. Weldhagen

Author affiliations: SA Pathology, Adelaide, South Australia, Australia (C.V. Moore, G.F. Weldhagen); Murdoch University, Murdoch, Western Australia, Australia (R.C.A. Thompson, L. Pallant); University of Melbourne, Melbourne, Victoria, Australia (A. Jabbar); Investigator Clinic, Port Lincoln, South Australia (J. Williams); Women’s and Children’s Hospital, Adelaide (K. Rasiah); SA Health Communicable Disease Control Branch, Adelaide (A.P. Koehler, C. Graham)
Main Article
Figure
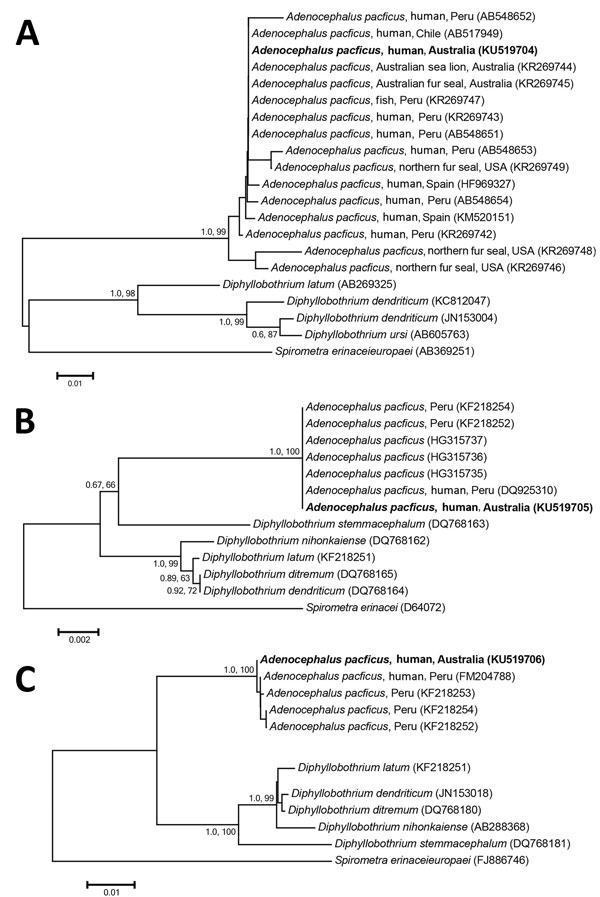
Figure. Phylogenetic relationship of genetic sequences from an Adenocephalus pacificus tapeworm obtained from a human in Australia (bold) and selected reference sequences. The relationship was inferred on the basis of DNA sequence analyses of cytochrome c oxidase 1 (A), small subunit RNA (B), and internal transcribed spacer (C) regions, using Bayesian inference and neighbor-joining phylogenetic methods. Topologies of trees generated by both methods were similar; thus, only neighbor-joining trees are shown here. Spirometra spp. were used as the outgroup. Nodal support is shown as posterior probability value (first) and bootstrap value (second) on the basis of 2 million generations for Bayesian inference and 10,000 replicates for neighbor joining, respectively. GenBank accession numbers are shown in parentheses. Scale bars indicate nucleotide substitutions per site.
Main Article
Page created: July 15, 2016
Page updated: July 15, 2016
Page reviewed: July 15, 2016
The conclusions, findings, and opinions expressed by authors contributing to this journal do not necessarily reflect the official position of the U.S. Department of Health and Human Services, the Public Health Service, the Centers for Disease Control and Prevention, or the authors' affiliated institutions. Use of trade names is for identification only and does not imply endorsement by any of the groups named above.