Skip directly to site content Skip directly to page options Skip directly to A-Z link Skip directly to A-Z link Skip directly to A-Z link
Volume 23, Number 11—November 2017
Dispatch

Bartonella quintana and Typhus Group Rickettsiae Exposure among Homeless Persons, Bogotá, Colombia

Álvaro A. Faccini-Martínez, Andrea C. Márquez, Diana M. Bravo-Estupiñan, Omar-Javier Calixto, Christian A. López-Castillo, Carlos A. Botero-García, Marylin Hidalgo, and Claudia CuervoComments to Author 
Author affiliations: Universidade Federal do Espírito Santo, Vitória, Espírito Santo, Brazil (Á.A. Faccini-Martínez); Pontificia Universidad Javeriana, Bogotá, Colombia (A.C. Márquez, D.M. Bravo-Estupiñan, M. Hidalgo, C. Cuervo); Hasselt University, Brussels, Belgium (O.-J. Calixto); Asociación Colombiana de Infectología, Bogotá (C.A. López-Castillo); Hospital Militar Central, Bogotá (C.A. Botero-García)

Main Article

Figure 2

Maximum-likelihood (ML) analyses of intergenic transcribed spacer 1 genes of Bartonella spp. and of the Pediculus humanus humanus louse mitochondrial cytochrome b (cytb) gene. A) Bartonella spp. analysis. The tree with the highest log likelihood is shown, and ML bootstrap values >80 are indicated at each node. The tree is drawn to scale. Sequences are indicated by GenBank accession number; Solid circle indicates the sequence retrieved in this study. The Bartonella species is indicated to the

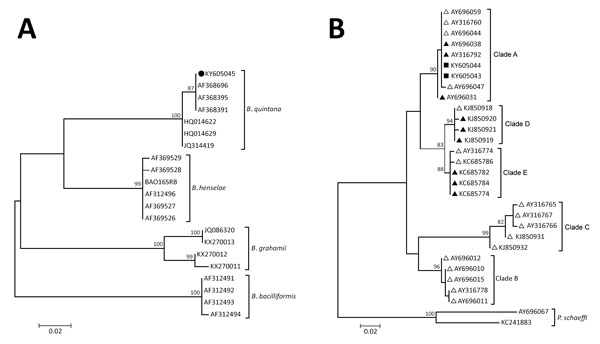
Figure 2. Maximum-likelihood (ML) analyses of intergenic transcribed spacer 1 genes of Bartonella spp. and of the Pediculus humanus humanus louse mitochondrial cytochrome b (cytb) gene. A) Bartonella spp. analysis. The tree with the highest log likelihood is shown, and ML bootstrap values >80 are indicated at each node. The tree is drawn to scale. Sequences are indicated by GenBank accession number; solid circle indicates the sequence retrieved in this study. The Bartonella species is indicated to the right of each branch. B) P. h. humanus analysis. The tree with the highest log likelihood is shown, and ML bootstrap values are located above the node. The tree is drawn to scale. The body louse sequences (solid triangles), head louse sequences (open triangles), and GenBank accession numbers are indicated. Cytochrome b sequences from Pediculus schaeffi were used as outgroups. Solid squares indicate the sequences retrieved in this study. The mitochondrial clade is indicated to the right of each branch. Scale bars indicate nucleotide substitutions per site.

Main Article

Page created: October 17, 2017
Page updated: October 17, 2017
Page reviewed: October 17, 2017
The conclusions, findings, and opinions expressed by authors contributing to this journal do not necessarily reflect the official position of the U.S. Department of Health and Human Services, the Public Health Service, the Centers for Disease Control and Prevention, or the authors' affiliated institutions. Use of trade names is for identification only and does not imply endorsement by any of the groups named above.
file_external