Insecticide-Treated Nets and Protection against Insecticide-Resistant Malaria Vectors in Western Kenya
Eric Ochomo
1
, Mercy Chahilu
1, Jackie Cook, Teresa Kinyari, Nabie M. Bayoh, Philippa West, Luna Kamau, Aggrey Osangale, Maurice Ombok, Kiambo Njagi, Evan Mathenge, Lawrence Muthami, Krishanthi Subramaniam, Tessa Knox, Abraham Mnavaza, Martin James Donnelly, Immo Kleinschmidt, and Charles Mbogo
Author affiliations: Kenya Medical Research Institute (KEMRI), Kisumu, Kenya (E. Ochomo, M. Chahilu, A. Osangale, M. Ombok); London School of Hygiene and Tropical Medicine, London, UK (J. Cook, P. West, I. Kleinschmidt); University of Nairobi, Nairobi, Kenya (T. Kinyari); US Centers for Disease Control and Prevention–Kenya, Nairobi (N.M. Bayoh); KEMRI, Nairobi (L. Kamau, E. Mathenge, L. Muthami); Ministry of Health, Nairobi (K. Njagi); Liverpool School of Tropical Medicine, Liverpool, UK (K. Subramaniam, M.J. Donnelly); World Health Organization, Geneva, Switzerland (T. Knox, A. Mnavaza); University of Witwatersrand, Johannesburg, South Africa (I. Kleinschmidt); KEMRI, Kilifi, Kenya (C. Mbogo); KEMRI–Wellcome Trust, Nairobi (C. Mbogo)
Main Article
Figure 1
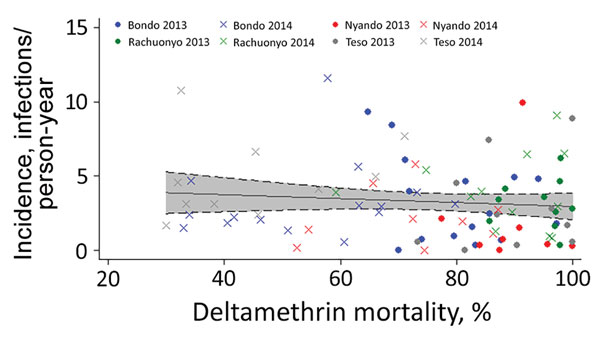
Figure 1. Relationship between deltamethrin insecticide resistance and incidence of malaria parasite infection, 4 subcounties, western Kenya, 2013 and 2014. The incidence of infection in the clusters from subcounties Bondo (blue), Ranchuonya (green), Nyando (red), and Teso (gray) in years 2013 (circles) and 2014 (Xs) were plotted against the corresponding values of mosquito mortality to deltamethrin for that year and that cluster. The best-fit line (with the 95% CI shaded in gray) for the scatterplot is nearly straight, suggesting no relationship between the incidence of infection and Anopheles gambiae sensu lato mosquito mortality upon exposure to deltamethrin measured by the World Health Organization bioassay.
Main Article
Page created: April 14, 2017
Page updated: April 14, 2017
Page reviewed: April 14, 2017
The conclusions, findings, and opinions expressed by authors contributing to this journal do not necessarily reflect the official position of the U.S. Department of Health and Human Services, the Public Health Service, the Centers for Disease Control and Prevention, or the authors' affiliated institutions. Use of trade names is for identification only and does not imply endorsement by any of the groups named above.