Volume 23, Number 8—August 2017
Dispatch
Density-Dependent Prevalence of Francisella tularensis in Fluctuating Vole Populations, Northwestern Spain
Ruth Rodríguez-Pastor, Raquel Escudero, Dolors Vidal, François Mougeot, Beatriz Arroyo, Xavier Lambin, Ave Maria Vila-Coro, Isabel Rodríguez-Moreno, Pedro Anda, and Juan J. Luque-Larena
Figure
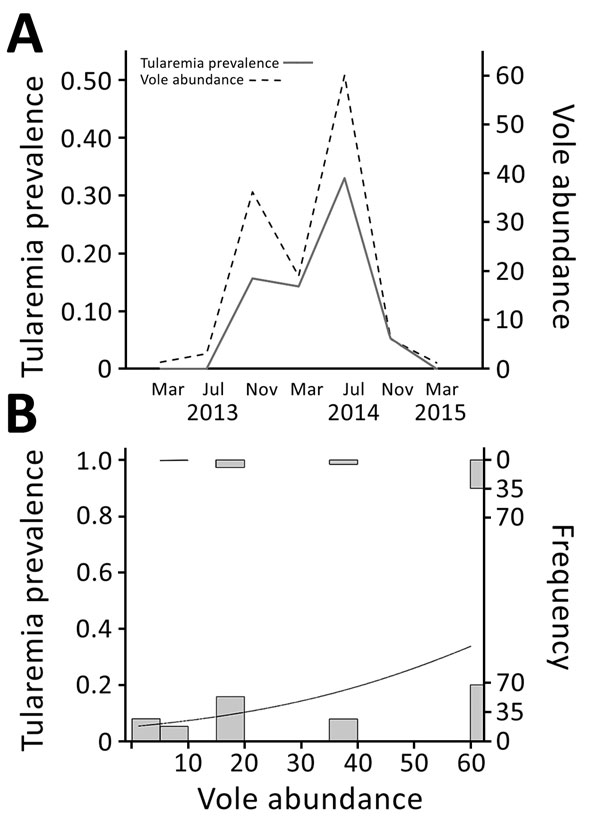
Figure. Vole abundance and tularemia prevalence, northwestern Spain. A) Temporal variations in vole abundance (no. captures/100 traps/24 h) and tularemia prevalence. Four voles were tested in March 2013, 15 in July 2013, 32 in November 2013, 63 in March 2014, 102 in July 2014, 19 in November 2014, and 8 in March 2015. B) Relationship between tularemia prevalence and vole abundance. Histograms show number of positive (top) or negative (bottom) voles sampled at each level of vole density. Curved line indicates a generalized linear model result.
Page created: July 17, 2017
Page updated: July 17, 2017
Page reviewed: July 17, 2017
The conclusions, findings, and opinions expressed by authors contributing to this journal do not necessarily reflect the official position of the U.S. Department of Health and Human Services, the Public Health Service, the Centers for Disease Control and Prevention, or the authors' affiliated institutions. Use of trade names is for identification only and does not imply endorsement by any of the groups named above.