Volume 24, Number 10—October 2018
Research
Mapping Histoplasma capsulatum Exposure, United States
Amelia W. Maiga, Stephen Deppen , Beth Koontz Scaffidi, John Baddley, Melinda C. Aldrich, Robert S. Dittus, and Eric L. Grogan
Figure 1
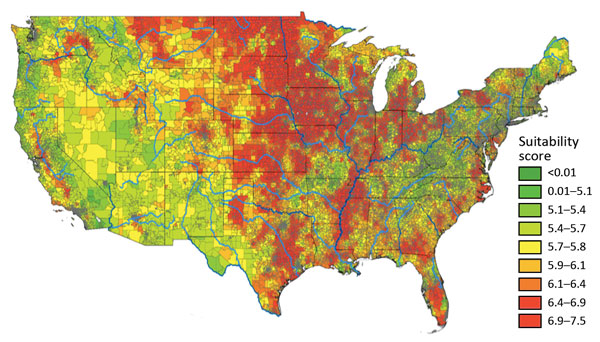
Figure 1. Mean Histoplasma site suitability score by US ZIP code. Red reflects greater histoplasmosis suitability; green reflects less suitability. The weighted mean score (Table) was calculated for each ZIP code. Data for geographic regions west of the Rocky Mountains are considered insufficient because of limited surface water data.
Page created: September 12, 2018
Page updated: September 12, 2018
Page reviewed: September 12, 2018
The conclusions, findings, and opinions expressed by authors contributing to this journal do not necessarily reflect the official position of the U.S. Department of Health and Human Services, the Public Health Service, the Centers for Disease Control and Prevention, or the authors' affiliated institutions. Use of trade names is for identification only and does not imply endorsement by any of the groups named above.