Volume 24, Number 11—November 2018
Research
Candida auris in South Africa, 2012–2016
Nelesh P. Govender , Rindidzani E. Magobo, Ruth Mpembe, Mabatho Mhlanga, Phelly Matlapeng, Craig Corcoran, Chetna Govind, Warren Lowman, Marthinus Senekal, and Juno Thomas
Figure 1
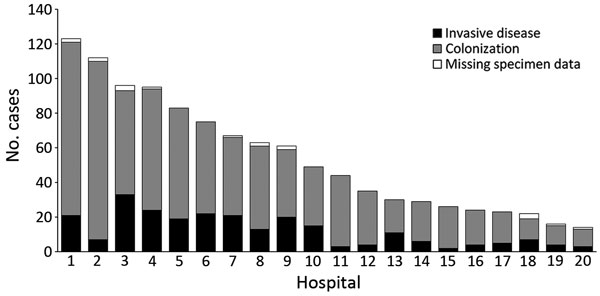
Figure 1. Distribution of cases of Candida auris by type of infection, South Africa, 2012–2016. Data are from the top 20 private hospitals that reported cases. n = 1,087.
Page created: October 17, 2018
Page updated: October 17, 2018
Page reviewed: October 17, 2018
The conclusions, findings, and opinions expressed by authors contributing to this journal do not necessarily reflect the official position of the U.S. Department of Health and Human Services, the Public Health Service, the Centers for Disease Control and Prevention, or the authors' affiliated institutions. Use of trade names is for identification only and does not imply endorsement by any of the groups named above.