Volume 24, Number 7—July 2018
Research
Mapping of the US Domestic Influenza Virologic Surveillance Landscape
Barbara Jester, Joy Schwerzmann, Desiree Mustaquim, Tricia Aden, Lynnette Brammer, Rosemary Humes, Pete Shult, Shahram Shahangian, Larisa Gubareva, Xiyan Xu, Joseph Miller, and Daniel Jernigan
Figure 3
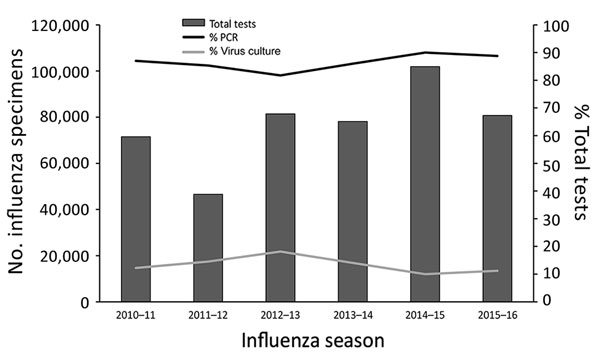
Figure 3. Number of influenza tests reported by public health laboratories to CDC since 2010. The number of specimens tested varies with the severity of the season. Since 2010, an average of 77,000 specimens has been tested annually. Multiple tests may be performed on a single specimen. Most tests have been PCR.
Page created: June 18, 2018
Page updated: June 18, 2018
Page reviewed: June 18, 2018
The conclusions, findings, and opinions expressed by authors contributing to this journal do not necessarily reflect the official position of the U.S. Department of Health and Human Services, the Public Health Service, the Centers for Disease Control and Prevention, or the authors' affiliated institutions. Use of trade names is for identification only and does not imply endorsement by any of the groups named above.