Volume 24, Number 9—September 2018
Dispatch
Estimating Frequency of Probable Autochthonous Cases of Dengue, Japan
Akiyoshi Senda1, Anavaj Sakuntabhai, Shinako Inaida, Yoann Teissier, Fumihiko Matsuda, and Richard E. Paul1
Figure 2
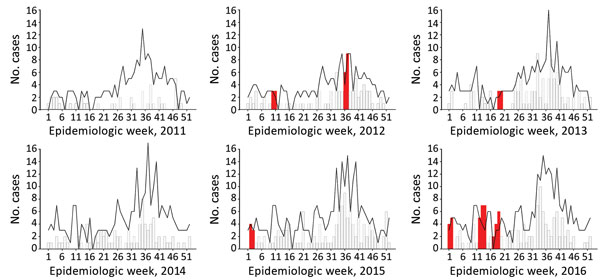
Figure 2. Detection of conditions warranting an autochthonous dengue case alert (red bars) compared with number of reported dengue cases per week (histogram) and estimated background threshold (black line), by year, Greater Tokyo area, Japan, 2011–2016.
1These authors contributed equally to this article.
Page created: August 14, 2018
Page updated: August 14, 2018
Page reviewed: August 14, 2018
The conclusions, findings, and opinions expressed by authors contributing to this journal do not necessarily reflect the official position of the U.S. Department of Health and Human Services, the Public Health Service, the Centers for Disease Control and Prevention, or the authors' affiliated institutions. Use of trade names is for identification only and does not imply endorsement by any of the groups named above.