Volume 25, Number 10—October 2019
Dispatch
New Exposure Location for Hantavirus Pulmonary Syndrome Case, California, USA, 2018
Figure

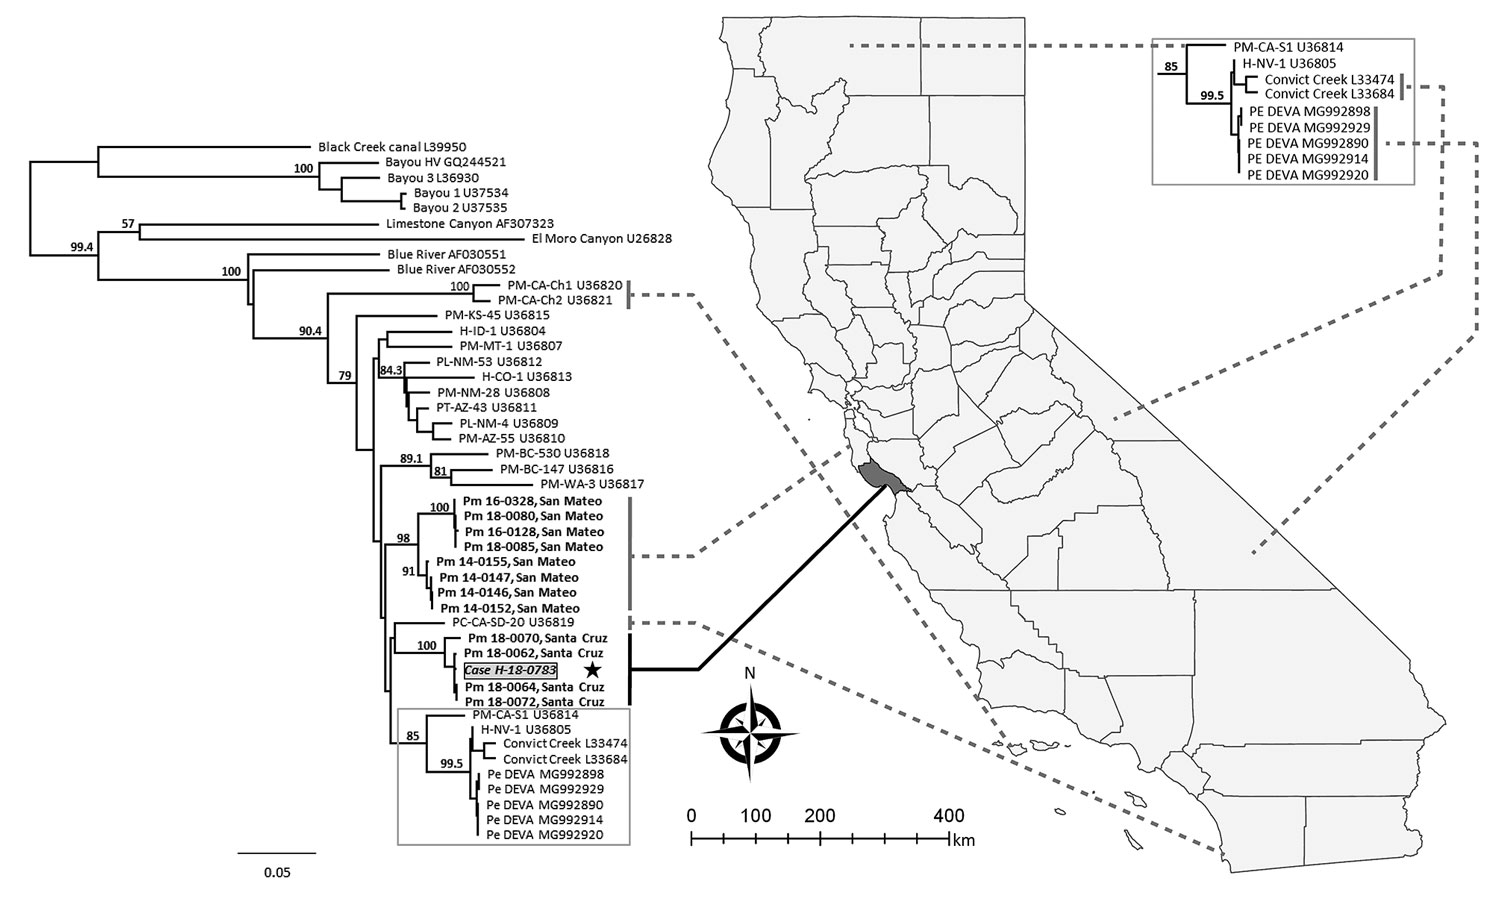
Figure. Phylogenetic tree of hantavirus Gn glycoprotein sequences from isolates collected in California, USA, and reference sequences. The hantavirus sequence from the case-patient described in this study (gray box) is shown in comparison to sequences from the case-patient farm in Santa Cruz County and archived samples from neighboring San Mateo County (bold). Dotted lines indicate general geographic origins of California sequences. Representative reference sequences of hantaviruses were downloaded from Genbank (accession numbers included in taxon labels). H indicates sequences from human cases; all other sequences are from small rodents. The tree was reconstructed by analysis of 848 bases of the glycoprotein precursor gene by using the neighbor-joining method and employing the Hasegawa-Kishino-Yano model to estimate genetic distances with Geneious 10.0 (https://www.geneious.com). We estimated support for relationships by using a nonparametric bootstrap analysis (1,000 replicates). Nodes with bootstrap percentages >50% are indicated. Similar tree topologies were generated from maximum-likelihood (RAxML) and Bayesian (Mr. Bayes) phylogenetic analyses (data not shown). Genbank accession numbers: Case H-18-0783, MK386451; Pm-18-0062, Santa Cruz, MK386452; Pm-18-0064, Santa Cruz, MK386453; Pm-18-0070, Santa Cruz, MK386454; Pm-18-0072, Santa Cruz, MK386455; Pm-14-0146, San Mateo, MK386456; Pm-14-0147, San Mateo, MK386457; Pm-14-0152, San Mateo, MK386458; Pm-14-0155, San Mateo, MK386459; Pm-16-0128, San Mateo, MK386460; Pm-16-0328, San Mateo, MK386461; Pm-18-0080, San Mateo, MK386462; and Pm-18-0085, San Mateo, MK386463. Scale bars represent the genetic distance (nucleotide substitutions per site).