Volume 25, Number 12—December 2019
Research
Cost-effectiveness of Prophylactic Zika Virus Vaccine in the Americas
Affan Shoukat, Thomas Vilches, and Seyed M. Moghadas
Figure 2
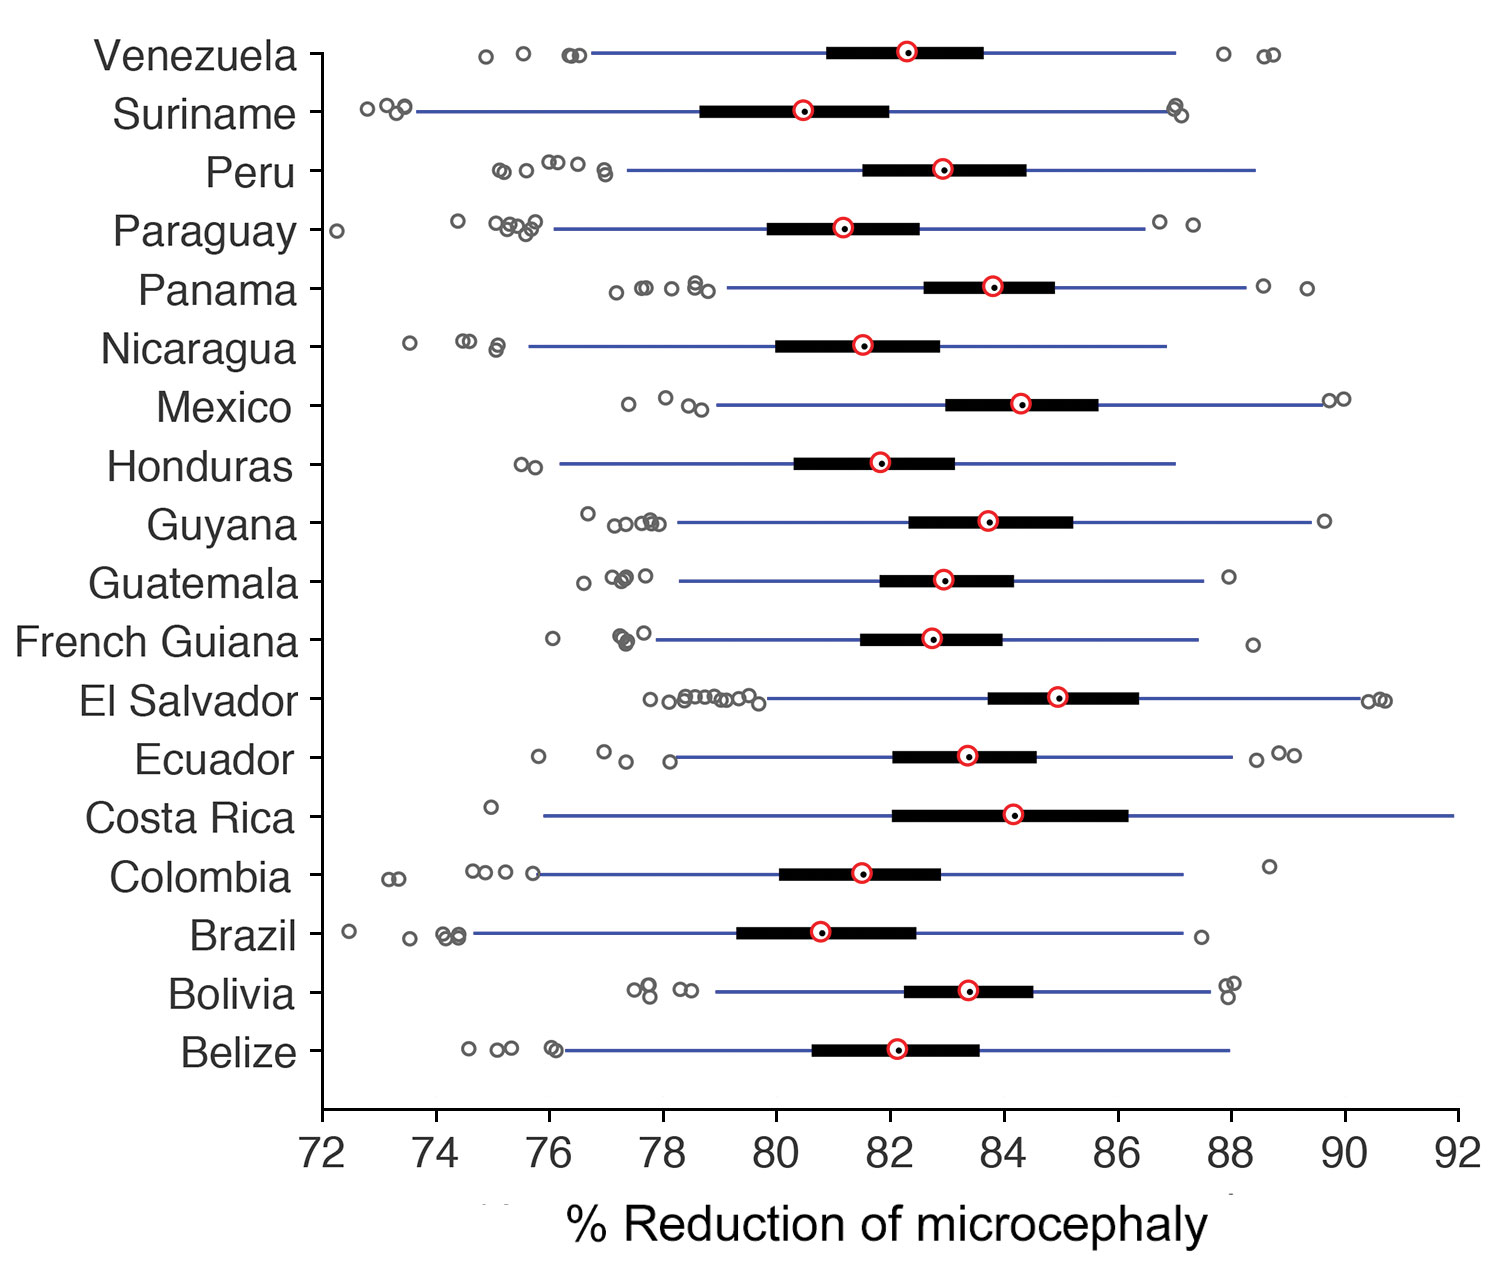
Figure 2. Box plots for the percentage reduction of microcephaly as a result of Zika virus vaccination. Red circles indicate medians; black bars indicate interquartile range (IQR); blue lines indicate extended range, from minimum (25th percentile – 1.5 IQR) to maximum (75th percentile + 1.5 IQR); dark circles indicate outliers.
Page created: November 18, 2019
Page updated: November 18, 2019
Page reviewed: November 18, 2019
The conclusions, findings, and opinions expressed by authors contributing to this journal do not necessarily reflect the official position of the U.S. Department of Health and Human Services, the Public Health Service, the Centers for Disease Control and Prevention, or the authors' affiliated institutions. Use of trade names is for identification only and does not imply endorsement by any of the groups named above.