Volume 25, Number 12—December 2019
Research
Epidemiologic, Entomologic, and Virologic Factors of the 2014–15 Ross River Virus Outbreak, Queensland, Australia
Cassie C. Jansen, Martin A. Shivas, Fiona J. May, Alyssa T. Pyke, Michael B. Onn, Kerryn Lodo, Sonja Hall-Mendelin, Jamie L. McMahon, Brian L. Montgomery, Jonathan M. Darbro, Stephen L. Doggett, and Andrew F. van den Hurk
Figure 5
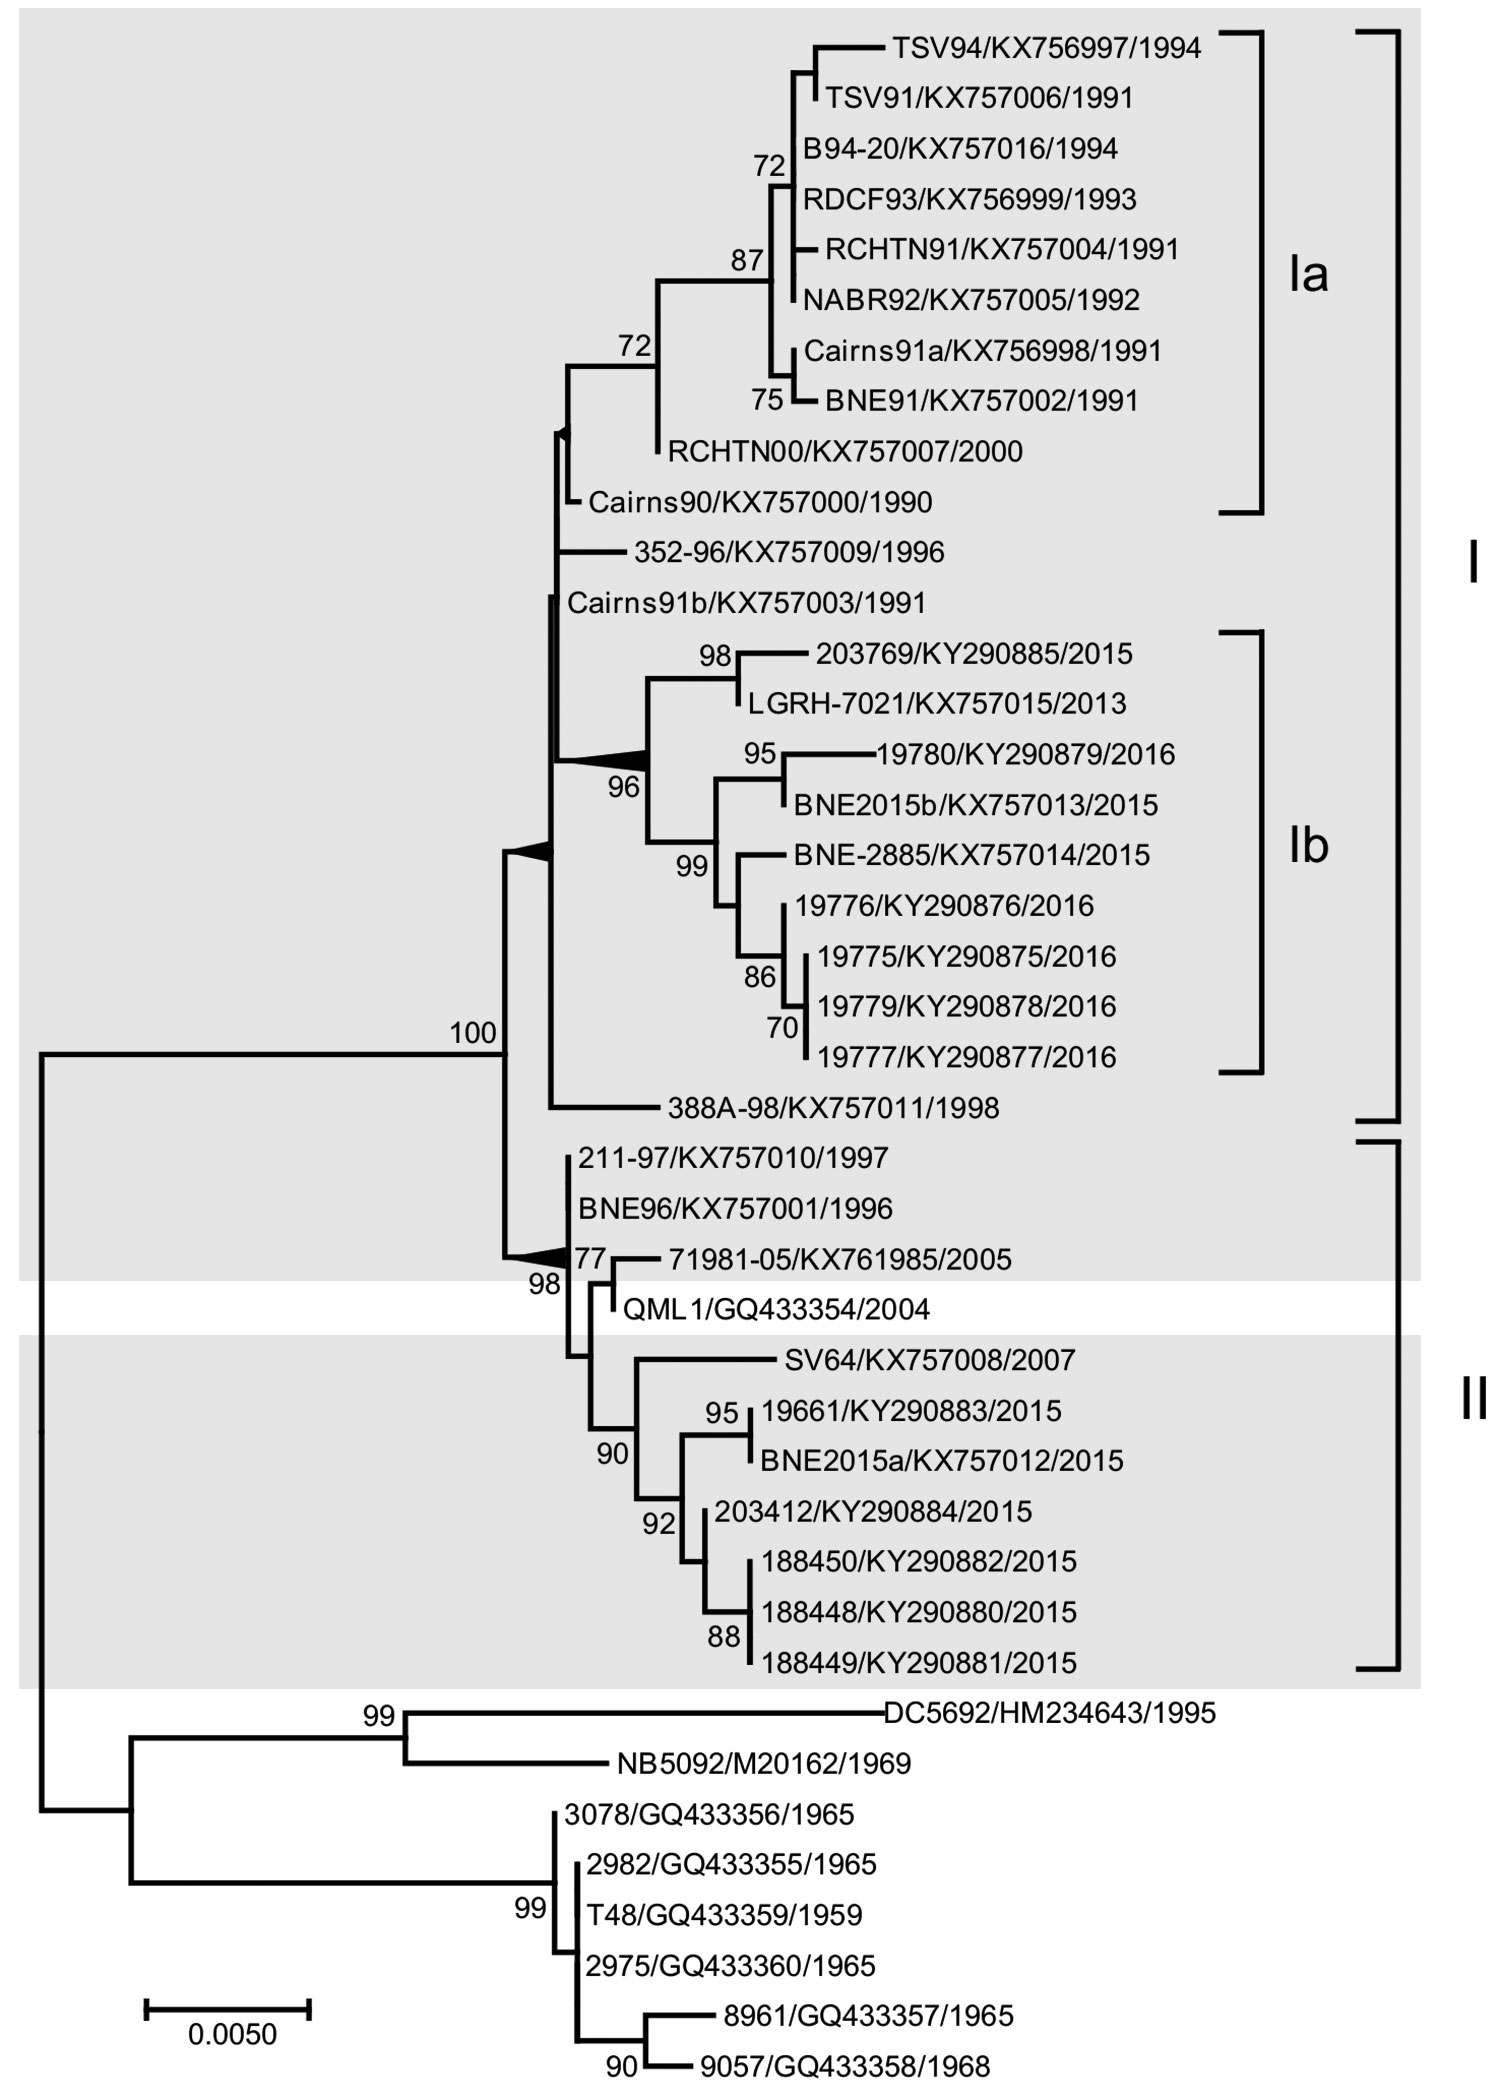
Figure 5. Maximum-likelihood phylogenetic tree of 41 complete Ross River virus envelope (E) 3 and E2 gene nucleotide sequences (1,458 nt), 32 from isolates collected in Queensland and New South Wales, Australia, during January 1, 1990–June 30, 2015 (gray shading), and 9 reference sequences. Tree was constructed by using MEGA 7.0 (https://megasoftware.net) with bootstrap support (1,000 replications). The tree is midpoint rooted for clarity. Circulating northeastern lineages I and II are shown together with sublineages Ia and Ib. Percentage bootstrap support values determined from 1,000 replicates are shown for key nodes. GenBank accession numbers are provided. Scale bar indicates nucleotide substitutions per site.
Page created: November 18, 2019
Page updated: November 18, 2019
Page reviewed: November 18, 2019
The conclusions, findings, and opinions expressed by authors contributing to this journal do not necessarily reflect the official position of the U.S. Department of Health and Human Services, the Public Health Service, the Centers for Disease Control and Prevention, or the authors' affiliated institutions. Use of trade names is for identification only and does not imply endorsement by any of the groups named above.