Skip directly to site content Skip directly to page options Skip directly to A-Z link Skip directly to A-Z link Skip directly to A-Z link
Volume 25, Number 12—December 2019
Dispatch

Influenza A(H1N1)pdm09 Virus Infection in a Captive Giant Panda, Hong Kong

Paolo Martelli1, Jade L.L. Teng1, Foo-Khong Lee, Kai-Yan Yeong, Jordan Y.H. Fong, Suk-Wai Hui, Kwok-Hung Chan, Susanna K.P. LauComments to Author , and Patrick C.Y. WooComments to Author 
Author affiliations: Ocean Park Corporation, Hong Kong, China (P. Martelli, F.-K. Lee, S.-W. Hui); The University of Hong Kong, Hong Kong (J.L.L. Teng, K.-Y. Yeong, J.Y.H. Fong, K.-H. Chan, S.K.P. Lau, P.C.Y. Woo); State Key Laboratory of Emerging Infectious Diseases at the University of Hong Kong, Hong Kong (J.L.L. Teng, K.-H. Chan, S.K.P. Lau, P.C.Y. Woo); Collaborative Innovation Center for Diagnosis and Treatment of Infectious Diseases at the University of Hong Kong, Hong Kong (S.K.P. Lau, P.C.Y. Woo)

Main Article

Figure 2

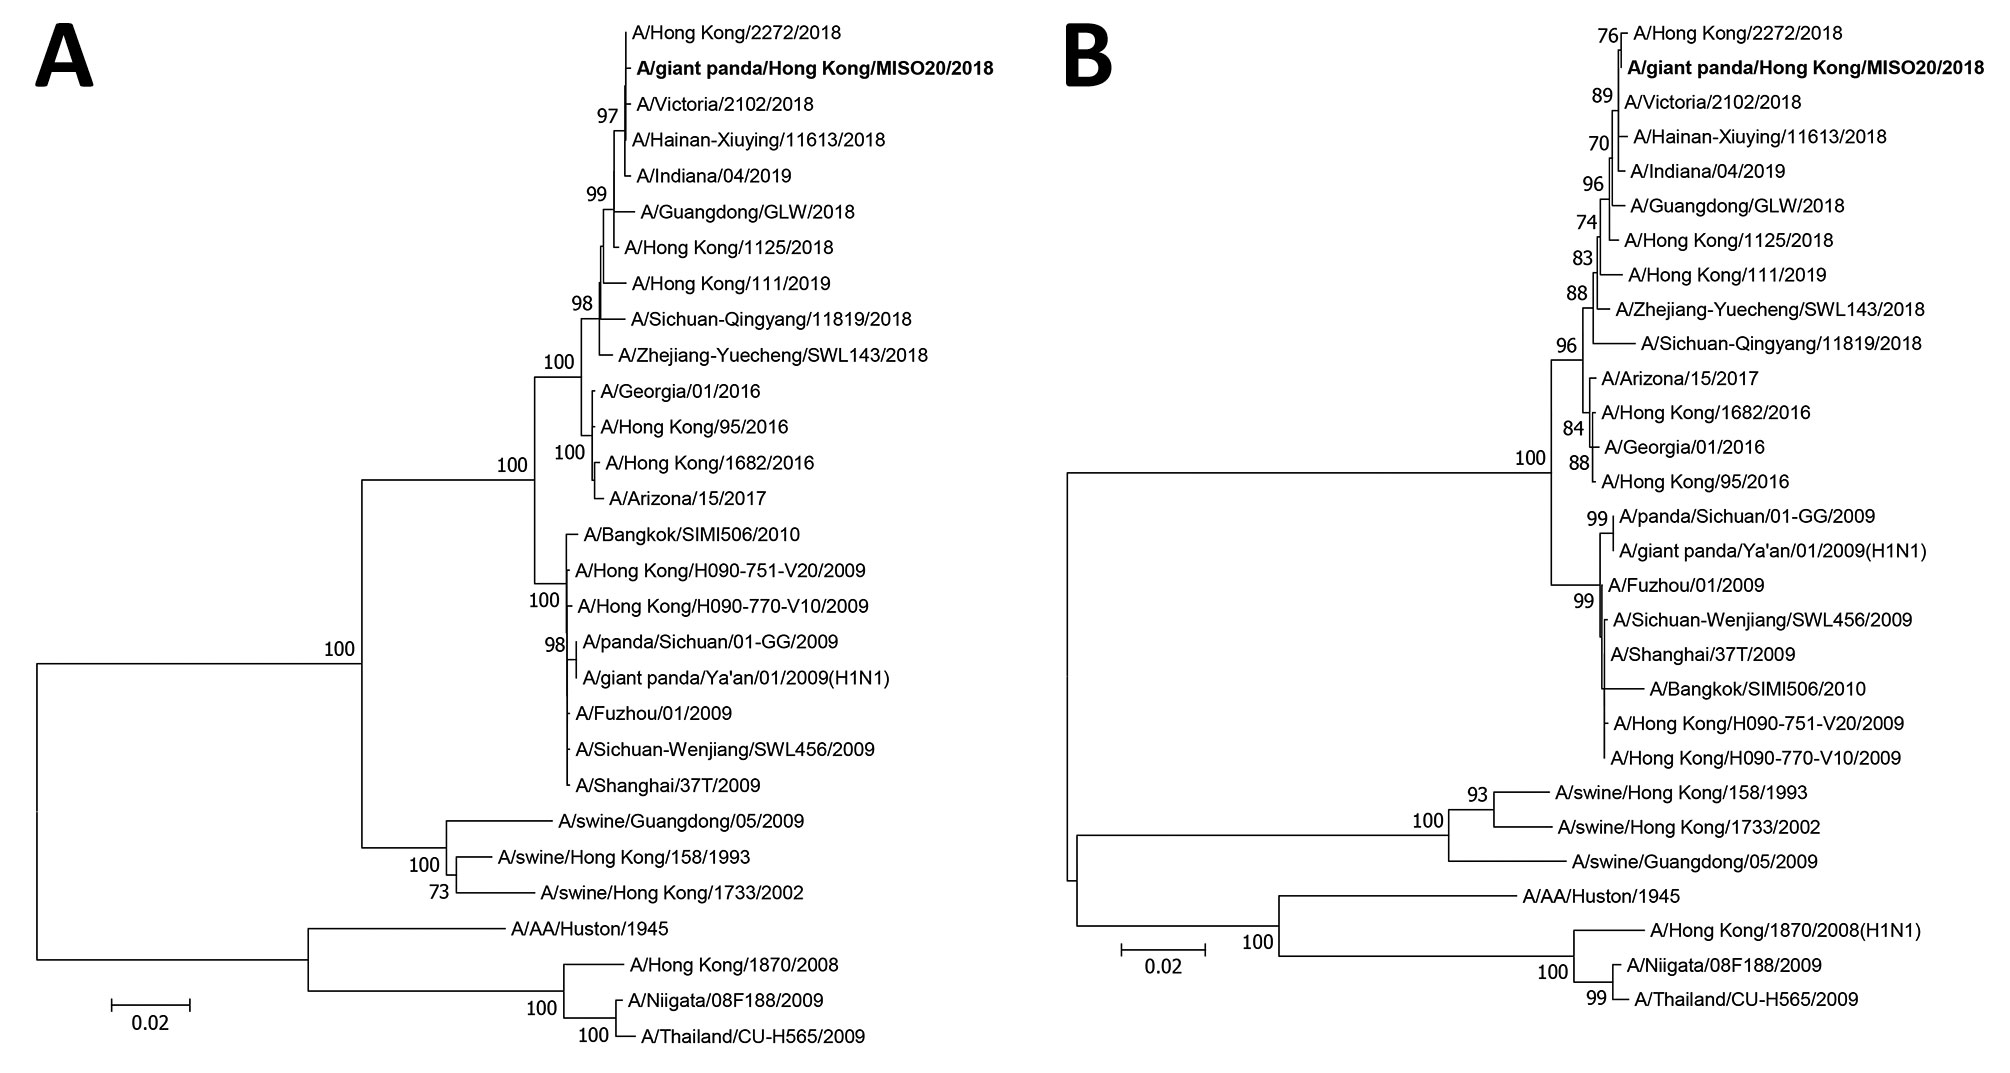
Phylogenetic analyses of (A) hemagglutinin and (B) neuraminidase gene sequences of influenza A(H1N1)pdm09 (A/giant panda/Hong Kong/MISO20/2018) isolated from a giant panda in Hong Kong, China (bold), and other previously characterized strains retrieved from GISAID. The trees were constructed by the neighbor-joining method using Kimura 2-parameter in MEGA6 (http://www.megasoftware.net). A total of 1,691 nt positions in hemagglutinin and 1,404 in neuraminidase genes were included in the analyses.

Figure 2. Phylogenetic analyses of (A) hemagglutinin and (B) neuraminidase gene sequences of influenza A(H1N1)pdm09 (A/giant panda/Hong Kong/MISO20/2018) isolated from a giant panda in Hong Kong, China (bold), and other previously characterized strains retrieved from GISAID. The trees were constructed by the neighbor-joining method using Kimura 2-parameter in MEGA6 (http://www.megasoftware.net). A total of 1,691 nt positions in hemagglutinin and 1,404 in neuraminidase genes were included in the analyses. Bootstrapping was performed with 1,000 replicates; only bootstrap values >700 are shown. Scale bars indicate nucleotide substitutions per site.

Main Article

1These authors contributed equally to this article.

Page created: November 18, 2019
Page updated: November 18, 2019
Page reviewed: November 18, 2019
The conclusions, findings, and opinions expressed by authors contributing to this journal do not necessarily reflect the official position of the U.S. Department of Health and Human Services, the Public Health Service, the Centers for Disease Control and Prevention, or the authors' affiliated institutions. Use of trade names is for identification only and does not imply endorsement by any of the groups named above.
file_external