Skip directly to site content Skip directly to page options Skip directly to A-Z link Skip directly to A-Z link Skip directly to A-Z link
Volume 26, Number 11—November 2020
Dispatch

KPC-3–Producing Serratia marcescens Outbreak between Acute and Long-Term Care Facilities, Florida, USA

Adriana JimenezComments to Author , Lilian M. Abbo, Octavio Martinez, Bhavarth Shukla, Kathleen Sposato, Alina Iovleva, Erin Louise Fowler, Christi Lee McElheny, and Yohei Doi
Author affiliations: Jackson Health System, Miami, Florida, USA (A. Jimenez, L. M. Abbo, K. Sposato); Florida International University Robert Stempel College of Public Health and Social Work, Miami (A. Jimenez); U; niversity of Miami Miller School of Medicine, Miami (L. M. Abbo, O. Martinez, B. Shukla); University of Pittsburgh School of Medicine, Pittsburgh, Pennsylvania, USA (A. Iovleva, E. L. Fowler, C. L. McElheny, Y. Doi)

Main Article

Figure 2

Core-genome SNP phylogeny of 12 Serratia marcescens isolates involved in outbreak in Miami, Florida, USA, 2018, depicted with KPC plasmid presence/absence matrix. Dotted circles indicate 3 major lineages involved in the outbreak. Nodes supported by bootstrap values of 100 are shown. A heat map of core genome SNP differences between strains involved in the outbreak shows genome similarity as measured by SNP distance; dark gray indicates higher similarity and lighter gray lower similarity. 1, pKP46-like; 2, pnJST258C2-like; 3, SER_520; 4, SER_508; 5, SER_502; 6, SER_500; 7, SER_514; 8, SER_501; 9, SER_518; 10, SER_505; 11, SER_522; 12, SER_523; 13, SER_525; 14, SER_517. Scale bar indicates number of differences between sequences. KPC, Klebsiella pneumoniae carbapenemase; SNP, single-nucleotide polymorphisms.

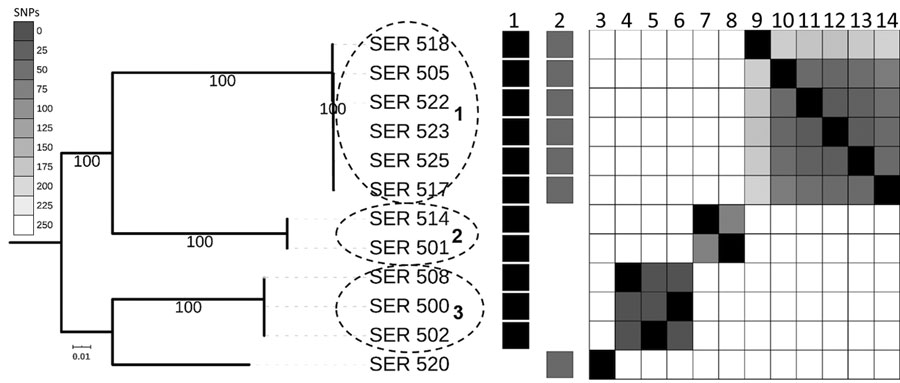
Figure 2. Core-genome SNP phylogeny of 12 Serratia marcescens isolates involved in outbreak in Miami, Florida, USA, 2018, depicted with KPC plasmid presence/absence matrix. Dotted circles indicate 3 major lineages involved in the outbreak. Nodes supported by bootstrap values of 100 are shown. A heat map of core genome SNP differences between strains involved in the outbreak shows genome similarity as measured by SNP distance; dark gray indicates higher similarity and lighter gray lower similarity. 1, pKP46-like; 2, pnJST258C2-like; 3, SER_520; 4, SER_508; 5, SER_502; 6, SER_500; 7, SER_514; 8, SER_501; 9, SER_518; 10, SER_505; 11, SER_522; 12, SER_523; 13, SER_525; 14, SER_517. Scale bar indicates number of differences between sequences. KPC, Klebsiella pneumoniae carbapenemase; SNP, single-nucleotide polymorphisms.

Main Article

Page created: September 15, 2020
Page updated: October 19, 2020
Page reviewed: October 19, 2020
The conclusions, findings, and opinions expressed by authors contributing to this journal do not necessarily reflect the official position of the U.S. Department of Health and Human Services, the Public Health Service, the Centers for Disease Control and Prevention, or the authors' affiliated institutions. Use of trade names is for identification only and does not imply endorsement by any of the groups named above.
file_external