Volume 26, Number 2—February 2020
Dispatch
Use of Surveillance Outbreak Response Management and Analysis System for Human Monkeypox Outbreak, Nigeria, 2017–2019
Bernard C. Silenou, Daniel Tom-Aba, Olawunmi Adeoye, Chinedu C. Arinze, Ferdinand Oyiri, Anthony K. Suleman, Adesola Yinka-Ogunleye, Juliane Dörrbecker, Chikwe Ihekweazu, and Gérard Krause
Figure 2
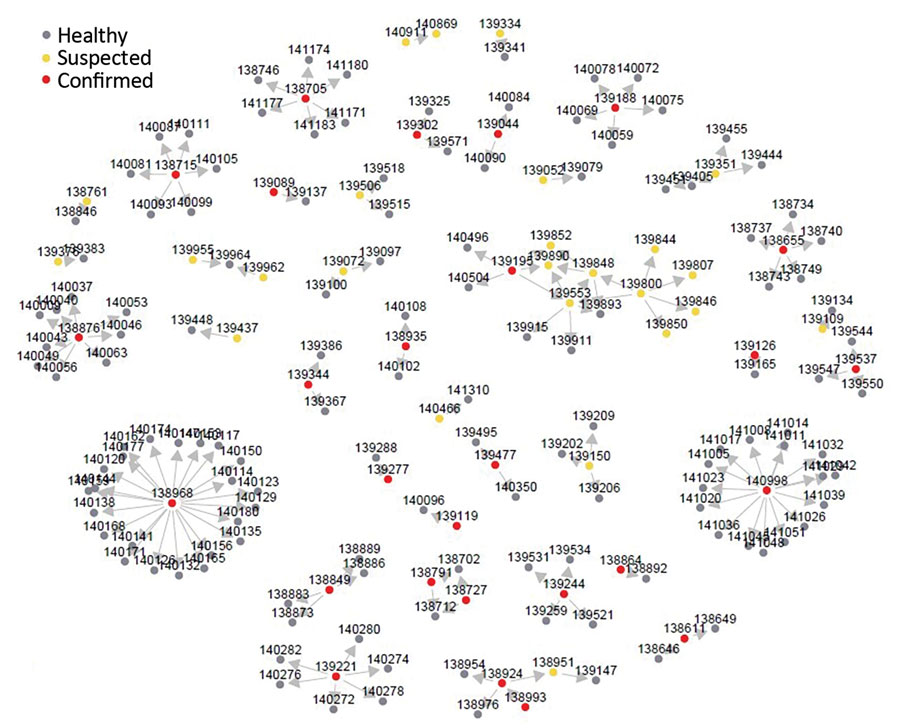
Figure 2. Network diagram for monkeypox cases and contact persons in Nigeria notified November 2017–July 2019. The nodes are labeled with unique identifiers for each person and colored by their classification status. Among case-patients, >1 contact person was reported for 57 (24%). The average number of contact persons/case-patient was 3 (quartiles 1–4, range 1–23). Arrows show the possible direction of infection transmission.
Page created: January 20, 2020
Page updated: January 20, 2020
Page reviewed: January 20, 2020
The conclusions, findings, and opinions expressed by authors contributing to this journal do not necessarily reflect the official position of the U.S. Department of Health and Human Services, the Public Health Service, the Centers for Disease Control and Prevention, or the authors' affiliated institutions. Use of trade names is for identification only and does not imply endorsement by any of the groups named above.