Volume 26, Number 4—April 2020
Research Letter
Plague Epizootic Dynamics in Chipmunk Fleas, Sierra Nevada Mountains, California, USA, 2013–2015
Figure
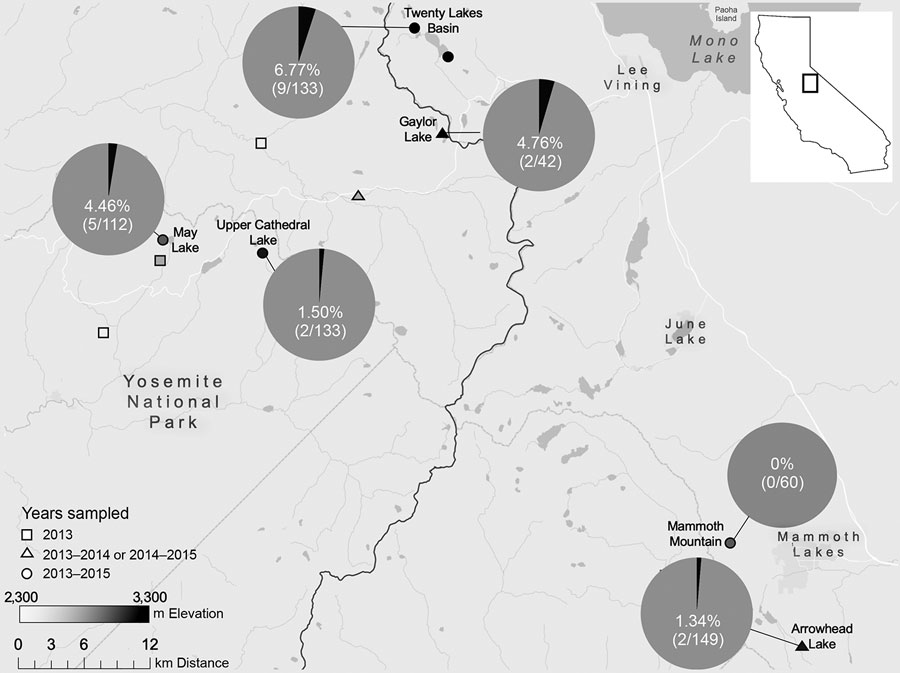
Figure. Minimum Yersinia pestis infection prevalence in fleas harbored by Tamius speciosus and T. alpinus chipmunks, by study site, Sierra Nevadas, California, 2013–2015. We visited sites for different numbers of years: 1 study year (2013 only), 2 study years, or all 3 study years. Plague prevalence was zero in 2013 and 2014, and map shows plague prevalence only in 2015. Pie charts show percentage of minimum infection prevalence (no. Y. pestis DNA–positive pools/no. fleas in pools tested). Sites without pie charts were either not visited in 2015 or had no flea pools collected there in 2015 because of low chipmunk prevalence. The irregular black line shows the eastern border of Yosemite National Park. Inset shows location of study sites in California. See Appendix Tables 1, 2 for more details on fleas tested.
1Current affiliation: San Diego Zoo Institute for Conservation Research, Escondido, California, USA.