Volume 26, Number 6—June 2020
Research
Multihost Transmission of Schistosoma mansoni in Senegal, 2015–2018
Figure
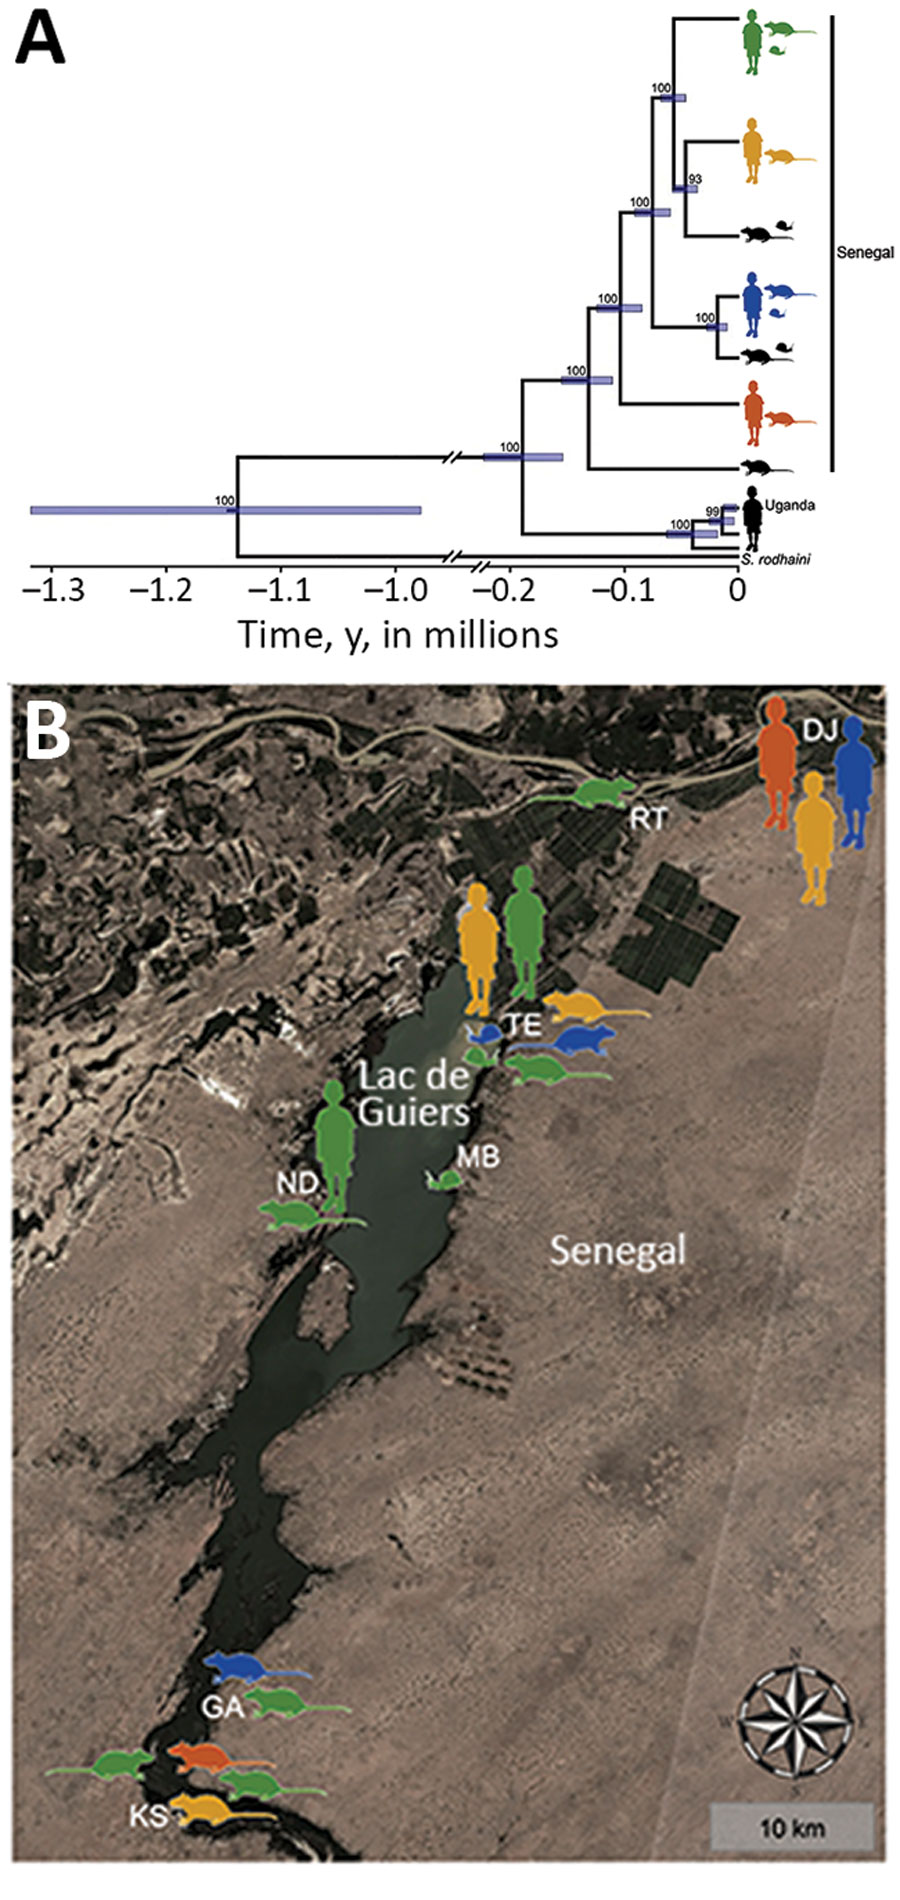
Figure. Phylogenetic analysis and geographic locations of Schistosoma mansoni lineages isolated from both humans and rodents (colored silhouettes) or from a single definitive host (black silhouettes), Senegal. Rodent silhouettes represent Mastomys huberti mice or Arvicanthis niloticus rats and snail silhouettes represent Biomphalaria pfeifferi snails (intermediate host). A) Bayesian tree made by using a strict molecular clock and the concatenated mitochondrial 12S rRNA and 4 protein-coding mitochondrial DNA gene sequences. Schistosoma rodhaini and S. mansoni samples from school-aged children in Uganda were included in the analysis. Posterior probabilities and 95% highest posterior density intervals (blue rectangles) are indicated for each node. Branches with nodal support <90% were collapsed. For complete tree, see AppendixS. mansoni lineages, Richard Toll and Lac de Guiers regions. Satellite imagery from Sentinel Hub (Sinergise, https://www.sentinel-hub.com) was used as the base layer. DJ, Didjiery; GA, Ganket; KS, Keur Momar Sarr; MB, Mbane; ND, Nder; RT, Richard Toll; TE, Temeye.
1These first authors contributed equally to this article.