Volume 26, Number 7—July 2020
Research
Paradoxal Trends in Azole-Resistant Aspergillus fumigatus in a National Multicenter Surveillance Program, the Netherlands, 2013–2018
Pieter P.A. Lestrade, Jochem B. Buil, Martha T. van der Beek, Ed J. Kuijper, Karin van Dijk, Greetje A. Kampinga, Bart J.A. Rijnders, Alieke G. Vonk, Sabine C. de Greeff, Annelot F. Schoffelen, Jaap van Dissel, Jacques F. Meis, Willem J.G. Melchers, Paul E. Verweij , and Kuijper
Figure 4
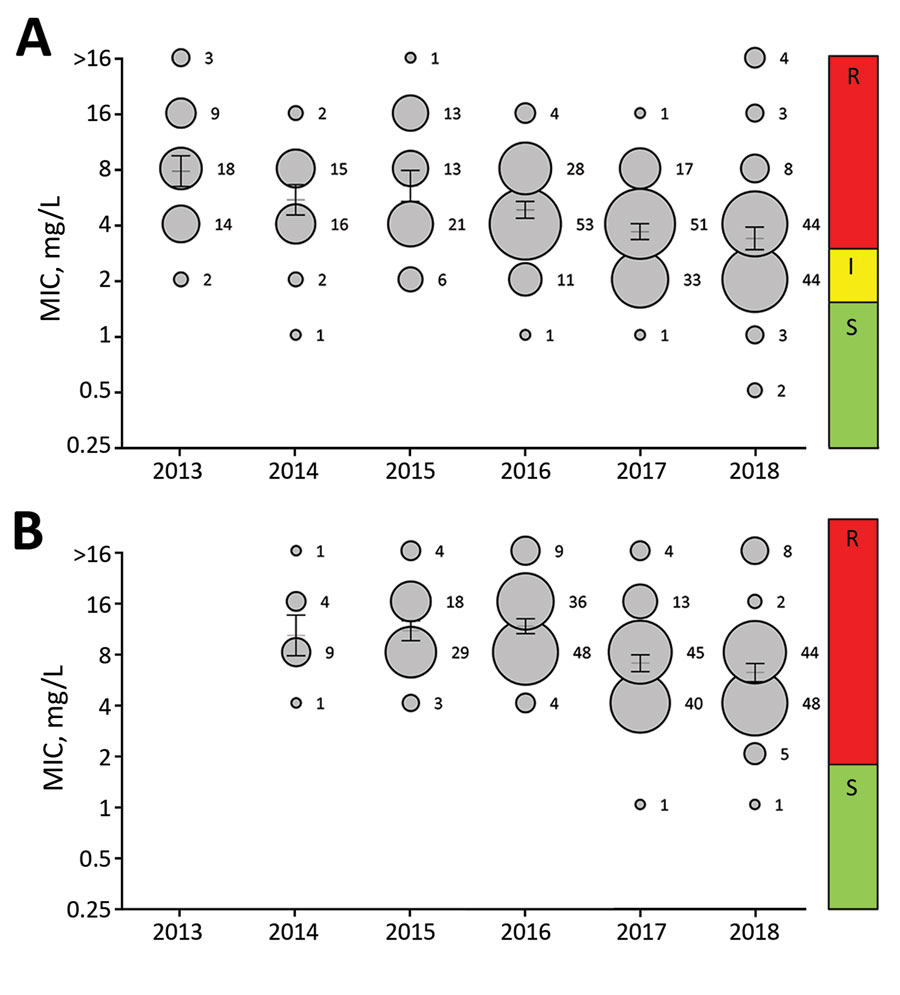
Figure 4. Trends in voriconazole (A) and isavuconazole (B) MIC distributions in Aspergillus fumigatus harboring TR34/L98H, as observed in a national multicenter surveillance program in the Netherlands, 2013–2018. MIC distribution is displayed as a bubble graph for each year, where the diameter corresponds with the number of isolates with the corresponding MIC. The number of isolates is presented for each MIC. Mean MIC with 95% CIs are plotted for each year as a line with error bars. The clinical interpretation is shown on the right of the diagram. I, intermediate; R, resistant; S, susceptible.
Page created: May 05, 2020
Page updated: June 18, 2020
Page reviewed: June 18, 2020
The conclusions, findings, and opinions expressed by authors contributing to this journal do not necessarily reflect the official position of the U.S. Department of Health and Human Services, the Public Health Service, the Centers for Disease Control and Prevention, or the authors' affiliated institutions. Use of trade names is for identification only and does not imply endorsement by any of the groups named above.