Volume 26, Number 7—July 2020
Dispatch
Aerosol and Surface Distribution of Severe Acute Respiratory Syndrome Coronavirus 2 in Hospital Wards, Wuhan, China, 2020
Figure 2
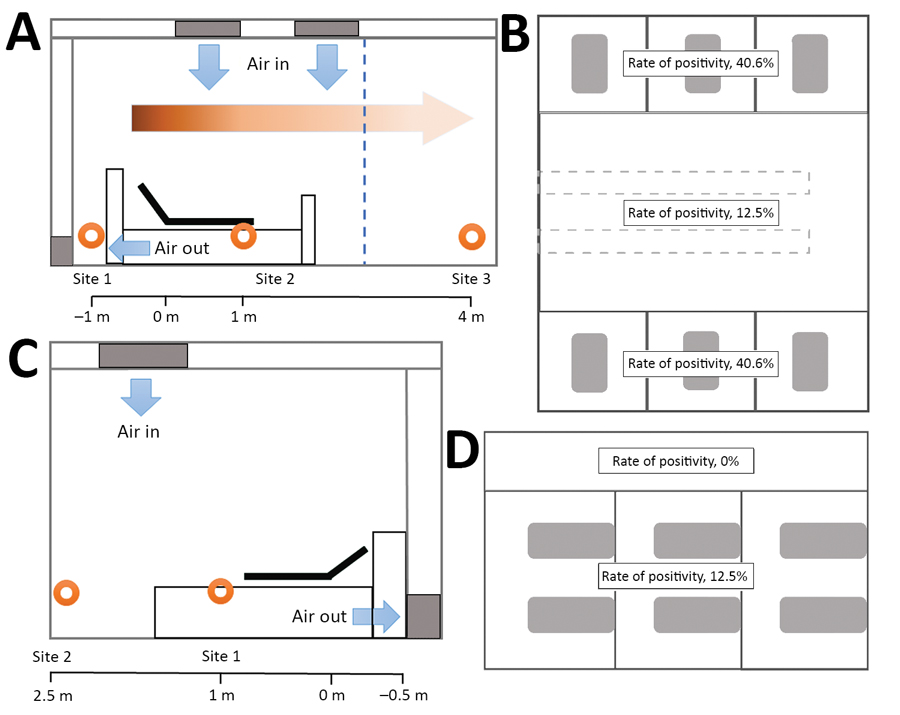
Figure 2. Spatial distribution of severe acute respiratory syndrome coronavirus 2 aerosols in isolation wards of the intensive care unit (ICU) and the general ward at Huoshenshan Hospital, Wuhan, China. A) The air sampling sites in the ICU were distributed in different regions: near the air outlet (site 1), near the patients (site 2), and around the doctors’ office area (site 3). Orange circles represent sampling sites; blue arrows represent direction of the fresh air flow; and the graded orange arrow and scale bar indicate the horizontal distance from the patient’s head. B) In terms of viral aerosol distribution, the space in the ICU was divided into 2 parts: a high-risk area with a 40.6% rate of virus positivity and a low-risk area with a 12.5% rate of virus positivity. C) The air sampling sites in the general ward were distributed in different regions around the patient (site 1), under the air inlet (site 2), and in the patient corridor. D) In terms of the viral aerosol distribution, the space in the general ward was divided into 2 parts: a high-risk area with a 12.5% rate of virus positivity and a low-risk area with a 0% rate of virus positivity.
1These authors contributed equally to this article.