Volume 26, Number 9—September 2020
Synopsis
Web-Based Interactive Tool to Identify Facilities at Risk of Receiving Patients with Multidrug-Resistant Organisms
Figure 3
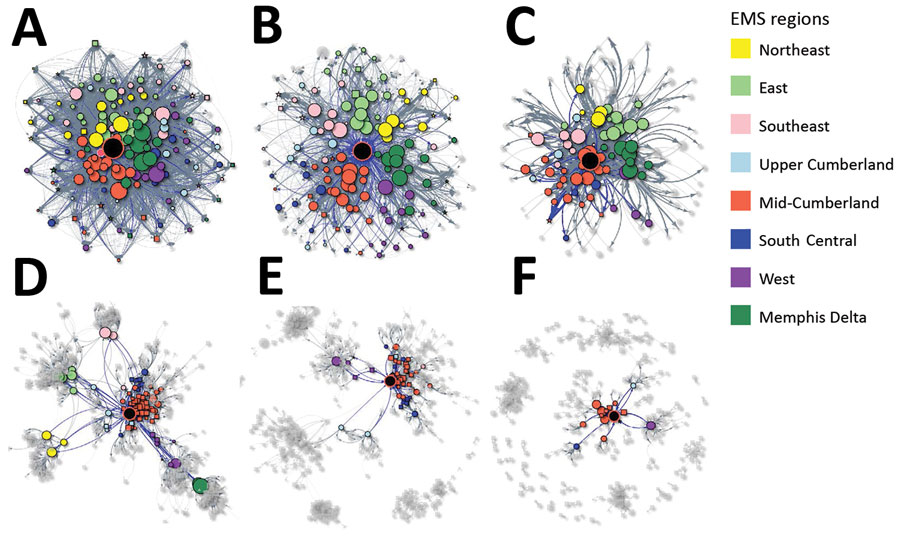
Figure 3. Varying user-tailored ego network visualizations in the web-based interactive tool to identify facilities at risk of receiving patients with multidrug-resistant organisms. Panels demonstrate options for visualizations for a large academic hospital from the HDDS and Centers for Medicare and Medicaid claims and MDS. Real-time use of the application enables users to tailor visualizations by facility, patient transfer threshold, and type of network. Black node in the center indicates the facility of interest (ego facility). The EMS region is represented by the node color for connected facilities and is represented by the color of the node border for the ego facility. Displays shown use the HDDS dataset (A–C) and MDS dataset (D–F). Panels A and D demonstrate a total patient sharing network; B and E demonstrate an uninterrupted patient sharing network; C and F are examples of alterations in patient threshold transfers and displays facilities that have >50 patient transfers to or with the ego facility. EMS, Emergency Medical Services; MDS, minimum dataset; HDDS, Tennessee Hospital Discharge Data System.