Volume 26, Number 9—September 2020
Synopsis
Saprochaete clavata Outbreak Infecting Cancer Center through Dishwasher
Figure 3
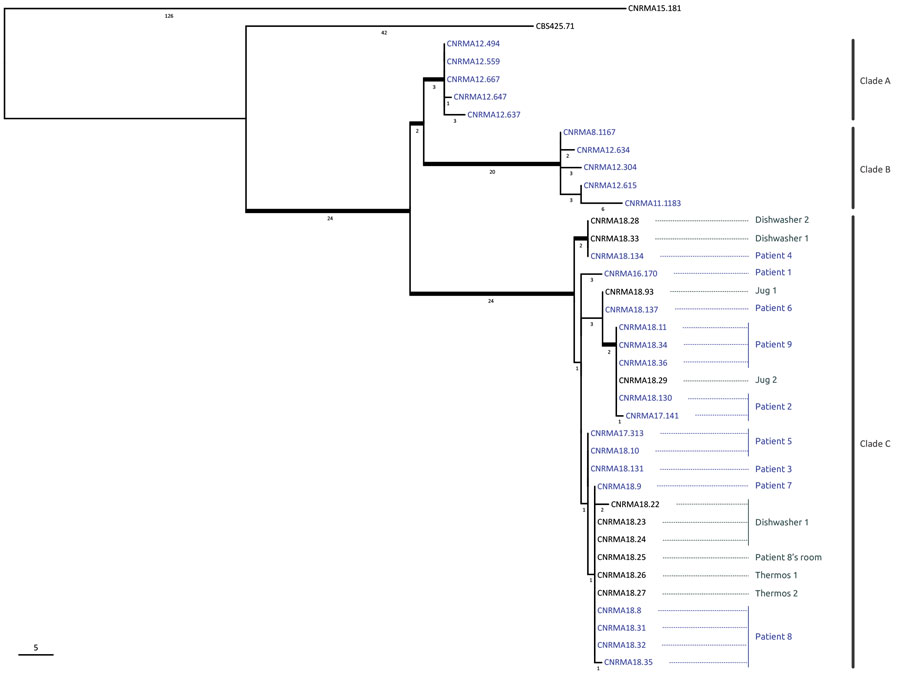
Figure 3. Phylogenetic tree of 38 Saprochaete clavata isolates, including isolates from outbreak of Saprochaete clavata at the Institut Paoli-Calmettes, Marseille, France, February 2016–December 2017. The unrooted maximum-likelihood tree was inferred from 12,053,164 nt characters with evolutionary model HKY (Hasegawa, Kishino, and Yano, 1985) + FO (base frequencies optimized by ML) + I (proportion of invariable sites optimized by ML). Thick branches are supported by >70% bootstrap supports (500 replicates). The approximated number of single-nucleotide polymorphisms is indicated below each branch. Blue indicates clinical isolates; gray indicates nonclinical isolates. Patient numbers correspond to those in the Table; clades A, B, and C are indicated at the right. Scale bar indicates single-nucleotide polymorphisms.