Volume 26, Number 9—September 2020
Research Letter
Effectiveness of N95 Respirator Decontamination and Reuse against SARS-CoV-2 Virus
Figure
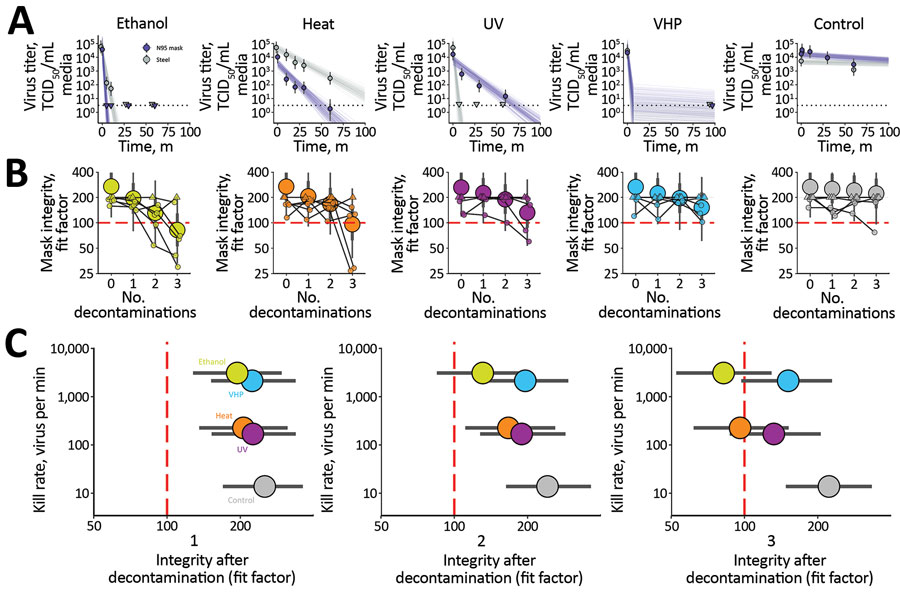
Figure. Results of decontamination of N95 respirators by 4 different methods. A) Inactivation of severe acute respiratory syndrome coronavirus 2 (SARS-CoV-2) virus (Appendix). Points indicate estimated mean viable titer across 3 replicates, circles the posterior median estimate of the mean, thick bars a 68% credible interval, and thin bars a 95% credible interval. Lines show predicted decay of virus titer over time and were generated by 50 random draws/replicate from the joint posterior distribution of the exponential decay rate (negative of the slope) and intercept (initial virus titer). Time points with no positive wells for any replicate are plotted as triangles at the approximate single-replicate LOD to indicate a plausible range of sub-LOD values. Black dotted line shows approximate LOD: 100.5 TCID50/mL media. Points at the LOD and at t = 0 for ethanol and heat methods applied to steel are offset slightly up and to the left to avoid overplotting. B) Mask integrity quantitative fit testing results after decontamination and 2 hours of wear for 3 consecutive runs. Data from 6 individual replicates (small circles and triangles) for each treatment are shown, in addition to estimated median fit factor (large circles), 68% range of underlying fit factors (thick bars), and 95% range (thin bars). Fit factors are a measure of filtration performance, the ratio of the concentration of particles outside the mask to the concentration inside. The measurement machine reports values <200; measured values of 200 are shown as upward-pointing triangles to indicate that true underlying values may be higher; other measured values are shown as circles. A minimal fit factor of 100 (red dashed line) is required for a mask to pass a fit test. See also Appendix50, 50% tissue culture infective dose; VHP, vaporized hydrogen peroxide.