Persistence of Severe Acute Respiratory Syndrome Coronavirus 2 in Aerosol Suspensions
Alyssa C. Fears, William B. Klimstra, Paul Duprex, Amy Hartman, Scott C. Weaver, Kenneth S. Plante, Divya Mirchandani, Jessica Ann Plante, Patricia V. Aguilar, Diana Fernández, Aysegul Nalca, Aysegul Totura, David Dyer, Brian Kearney, Matthew Lackemeyer, J. Kyle Bohannon, Reed Johnson, Robert F. Garry, Doug S. Reed
1, and Chad J. Roy
1
Author affiliations: Tulane University School of Medicine, New Orleans, Louisiana, USA (A.C. Fears, R.F. Garry, C.J. Roy):; University of Pittsburgh, Pittsburgh, Pennsylvania, USA (W.B. Klimstra, P. Duprex, A. Hartman, D.S. Reed); University of Texas Medical Branch, Galveston, Texas, USA (S.C. Weaver, K.S. Plante, D. Mirchandani, J.A. Plante, P.V. Aguilar, D. Fernández); U.S. Army Medical Research Institute of Infectious Diseases, Fort Detrick, Maryland, USA (A. Nalca, A. Totura, D. Dyer, B. Kearney); National Institute of Allergy and Infectious Diseases, National Institutes of Health, Fort Detrick, Maryland, USA (M. Lackemeyer, J.K. Bohannon, R. Johnson)
Main Article
Figure 2

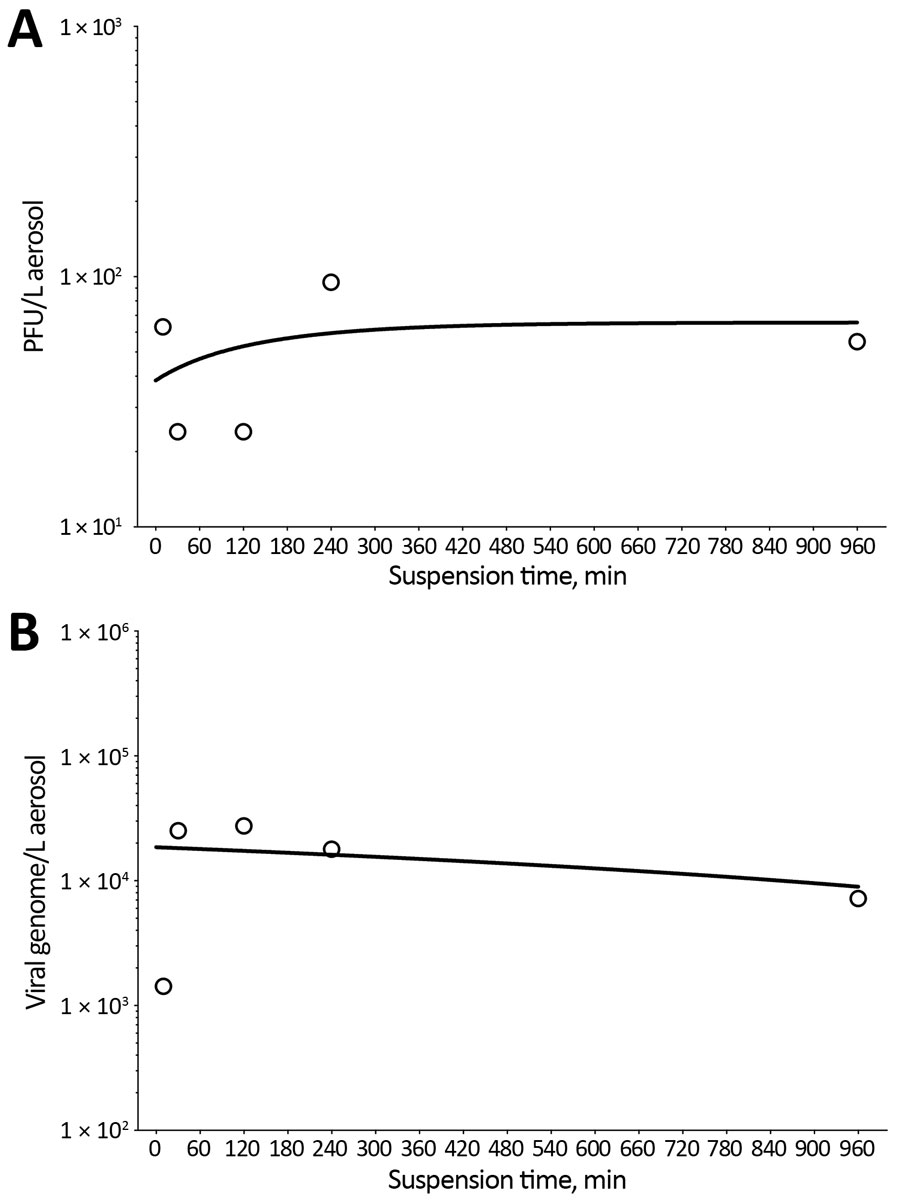
Figure 2. Decay curves of severe acute respiratory syndrome coronavirus 2 (SARS-CoV-2) in aerosol suspension. A) Aerosol concentration of infectious SARS-CoV-2 as measured by plaque assay found in impinger samples collected at 5 time points of increased aging in aerosol suspension. B) Corresponding aerosol concentration of SARS-CoV-2 in time-matched impinger samples as a function of viral genome copies as measured by reverse transcription quantitative PCR. Both time point virus estimates were graphed, and nonlinear least-squares regression analysis single-order decay with no outlier detection was performed, resulting in a poor curve fit by either method of viral quantitation resulting from number and lack of iterative samples in this analysis.
Main Article
Page created: June 15, 2020
Page updated: August 19, 2020
Page reviewed: August 19, 2020
The conclusions, findings, and opinions expressed by authors contributing to this journal do not necessarily reflect the official position of the U.S. Department of Health and Human Services, the Public Health Service, the Centers for Disease Control and Prevention, or the authors' affiliated institutions. Use of trade names is for identification only and does not imply endorsement by any of the groups named above.
