Skip directly to site content Skip directly to page options Skip directly to A-Z link Skip directly to A-Z link Skip directly to A-Z link
Volume 26, Number 9—September 2020
Research Letter

Effect of Environmental Conditions on SARS-CoV-2 Stability in Human Nasal Mucus and Sputum

M. Jeremiah Matson, Claude Kwe Yinda, Stephanie N. Seifert, Trenton Bushmaker, Robert J. Fischer, Neeltje van Doremalen, James O. Lloyd-Smith, and Vincent J. MunsterComments to Author 
Author affiliations: Marshall University Joan C. Edwards School of Medicine, Huntington, West Virginia, USA (M.J. Matson); Rocky Mountain Laboratories, National Institute of Allergy and Infectious Diseases, National Institutes of Health, Hamilton, Montana, USA (M.J. Matson, C. Kwe Yinda, S.N. Seifert, T. Bushmaker, R.J. Fischer, N. van Doremalen, V.J. Munster); Montana State University, Bozeman, Montana, USA (T. Bushmaker); University of California, Los Angeles, Los Angeles, California, USA (J.O. Lloyd-Smith)

Main Article

Figure

Stability of severe acute respiratory syndrome coronavirus 2 over time in human nasal mucus and sputum under different environmental conditions: liquid nasal mucus (A), surface nasal mucus (B), liquid sputum (C), and surface sputum (D). For panels B and D, the squares correspond to viral titer on the left y-axis, and the circles correspond to viral RNA (Ct value) on the right y-axis. We collected samples in 1 mL media for each condition at 0, 1, 4, 8, and 24 hours, then daily for 7 days and perf

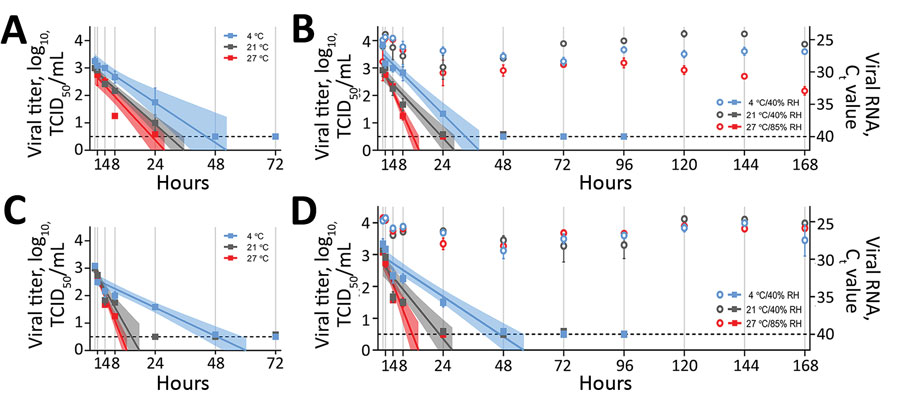
Figure. Stability of severe acute respiratory syndrome coronavirus 2 over time in human nasal mucus and sputum under different environmental conditions: liquid nasal mucus (A), surface nasal mucus (B), liquid sputum (C), and surface sputum (D). For panels B and D, the squares correspond to viral titer on the left y-axis, and the circles correspond to viral RNA (Ct value) on the right y-axis. We collected samples in 1 mL media for each condition at 0, 1, 4, 8, and 24 hours, then daily for 7 days and performed end-point titrations in quadruplicate on Vero E6 cells and made calculations using the Spearman-Kärber method. We log10-transformed and fit titers with linear regression models, including 95% CIs (shaded area around lines of best fit), by using GraphPad Prism 8 (https://www.graphpad.com). We extracted aliquots of collected surface samples by using the QIAamp Viral RNA Mini Kit (QIAGEN, https://www.qiagen.com) and analyzed them for the presence of viral RNA by using quantitative reverse transcription PCR targeting the E gene. For both viral titers and Ct values, plots show means of 3 replicates with SE. The limit of detection for each experimental condition was 100.5 TCID50/mL for viral titer and 40 for Ct value and is indicated by the dashed line. Relative humidity is not applicable to liquid samples (panels A and C), which were in sealed tubes. Ct, cycle threshold; RH, relative humidity; TCID50/mL, 50% tissue culture infective dose/mL.

Main Article

Page created: June 05, 2020
Page updated: August 20, 2020
Page reviewed: August 20, 2020
The conclusions, findings, and opinions expressed by authors contributing to this journal do not necessarily reflect the official position of the U.S. Department of Health and Human Services, the Public Health Service, the Centers for Disease Control and Prevention, or the authors' affiliated institutions. Use of trade names is for identification only and does not imply endorsement by any of the groups named above.
file_external