Volume 27, Number 1—January 2021
Dispatch
Impact of a Nationwide Lockdown on SARS-CoV-2 Transmissibility, Italy
Cite This Article
Citation for Media
Abstract
On March 11, 2020, Italy imposed a national lockdown to curtail the spread of severe acute respiratory syndrome coronavirus 2. We estimate that, 14 days after lockdown, the net reproduction number had dropped below 1 and remained stable at »0.76 (95% CI 0.67–0.85) in all regions for >3 of the following weeks.
On February 21, 2020, the earliest known case of locally transmitted severe acute respiratory syndrome coronavirus 2 (SARS-COV-2) infection was reported in Italy (1; D. Cereda et al., unpub. data, https://arxiv.org/abs/2003.09320). Since then, several interventions have been deployed to control disease spread in regions with sustained transmission, including quarantine of most-affected municipalities, ban of mass gatherings, and local school closures. School closure at the national level was mandated on March 5, and a national lockdown (stay-home mandate and closure of all nonessential productive activities) was issued on March 11 (2,3), then eased after May 4, 2020 (Appendix). The aim of this study is to evaluate the impact of these interventions on SARS-CoV-2 transmissibility in Italy.
We measured SARS-CoV-2 transmissibility in terms of the basic (R0) and net (Rt) reproduction numbers. These quantities represent the mean number of secondary infections generated by 1 primary infector in a fully susceptible population (R0) and in the presence of control interventions and human behavioral adaptations (Rt). When Rt decreases below the threshold of 1, the number of new infections begins to decline. Estimates were obtained through a Bayesian approach applied to case-based surveillance data collected by regional health authorities (Appendix).
To account for the geographic heterogeneity in contacts, healthcare organization, and timelines of interventions, Rt was estimated separately for different provinces and regions. We considered all 19 regions in Italy plus the 2 autonomous provinces of Trento and Bolzano. Moreover, we considered 100 of the remaining 105 provinces for which the data were sufficiently complete. The selected provinces covered 99.1% of the population of Italy and, as of May 3, 2020, accounted for 153,558 symptomatic cases (97.9% of the total recorded in the surveillance database). To evaluate the progressive decrease of transmission, we computed Rt at 3 dates: the day before lockdown (March 10) and 1 and 2 weeks after lockdown (March 18 and 25). In addition, we considered the average value of Rt over the successive 3 weeks (March 26–April 15). These choices were suggested by the trend of the national Rt (Appendix).
Figure 1
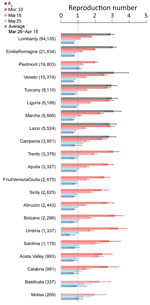
Figure 1. Basic (R0) and net reproduction numbers for severe acute respiratory syndrome coronavirus 2 for all regions and autonomous provinces in Italy. Regions are sorted by decreasing number of...
The R0 range was 2.83–3.10 (Figure 1) in the 8 regions for which the estimate was possible (Appendix). On March 10, Rt range was 1.79–3.36 across regions; Basilicata and Molise had an insufficient number of symptomatic cases (Figure 1). One week into lockdown, on March 18, Rt had decreased consistently, but no region or autonomous province was yet below the epidemic threshold (Figure 1). As of March 25, Rt was <1 in most regions and autonomous provinces (12/21) and <1 in the successive 3 weeks for all regions except Molise and Piedmont (Figure 1). The mean value of Rt across the regions and autonomous provinces, weighted by the number of reported cases at the corresponding date, fell from an average of 2.03 (95% CI 1.94–2.13) on March 10 to 1.28 (95% CI 1.23–1.33) on March 18, to 0.88 (95% CI 0.84–0.91) on March 25, corresponding to an overall 62.6% reduction (range across regions 45.6%–85.0%). In the 3 weeks of March 26–April 15, Rt remained stable in all regions, showing a further slight reduction at an average value of 0.76 (95% CI 0.67–0.85).
Figure 2
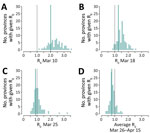
Figure 2. Distribution of the mean net reproduction numbers for severe acute respiratory syndrome coronavirus 2 in 100 selected provinces in Italy. Green lines indicate average value of Rt, weighted...
Results were consistent when analyzing estimates from the 100 selected provinces (Figure 2). As of March 10, no province had a mean estimated value of Rt <1 (n = 75; the number of symptomatic cases was insufficient for the estimate in 25 provinces). One week after lockdown, on March 18, 5/93 provinces (5.4%) had an average Rt <1, whereas on March 25 this figure increased to 49/96 provinces (51.0%). The fraction of provinces with Rt below 1 rose to 84/100 (84.0%) when considering the average over the following 3 weeks. The mean value of the reproduction number across the provinces, weighted by the province’s number of reported cases at the corresponding date, was 2.01 (95% CI 1.83–2.22) on March 10, 1.26 (95%CI 1.15–1.38) on March 18, 0.88 (95% CI 0.79–0.97) on March 25, and 0.77 (95% CI 0.63–0.95) for the period March 26–April 15.
Our results suggest that the national lockdown put in place as of March 11 to limit the spread of SARS-CoV-2 in Italy brought Rt below 1 in most regions and provinces within 2 weeks. Although Rt had been declining steeply even before the national lockdown (3) in regions with intense interventions, we estimated that the epidemic was brought under control only after the implementation of the lockdown. Lockdown was fundamental to prevent an explosion in the number of cases in other regions in which transmission had started weeks later compared with the outbreak epicenter (Lombardy, Veneto, Emilia Romagna). The range of estimates of R0 in 8 regions was 2.8–3.1, within the range of estimates obtained for other countries (4–6).
A massive and sustained scale-up of testing capacity was set up in all regions of Italy during the course of the epidemic (7); it was not accompanied by a corresponding increase of confirmed incident cases in the weeks following March 25, as indicated by the declining proportion of positive tests (Appendix). This finding suggests an increase of notification rates and thus a possible overestimation of Rt (8). To compensate for possible biases, we supplemented our results by computing alternative estimates based on the time series of hospitalized cases. Criteria for hospitalization are more homogeneous across local health systems and over time than testing criteria because they are grounded in the patient’s need for medical assistance. Furthermore, the hospitalization date is an easier piece of information to collect with respect to the symptom onset date, which requires an epidemiologic investigation and may be subject to recall bias. Results obtained with this additional method were consistent with our conclusions (Appendix).
We did not consider asymptomatic cases in our analysis. The adopted methodology is robust even in the presence of large underdetection rates, provided that these rates are constant over time or even slightly fluctuating (8,9). We did not consider imported cases either, due to the lack of data; imported cases are potential infectors, but do not contribute to the number of transmitted cases, thereby lowering estimates of reproduction numbers. In Italy, most cases were probably locally transmitted. After March 11, the ban of movement across provinces imposed by the lockdown made the role of imported cases negligible. Reproduction numbers were computed using the distribution of serial interval for Italy (10; D. Cereda et al.), which is an acceptable approximation of the generation interval (11; S. Hu et al., unpub. data, https://10.1101/2020.07.23.20160317). Both distributions are strongly influenced by country-dependent variables, such as behavior of infected persons and the adopted interventions. Estimates of the generation interval distribution are still unavailable for Italy as of October 2020.
Italy was the first country outside of Asia to impose a nationwide lockdown, rapidly followed by many countries worldwide. The effectiveness of lockdown had been proven in China, where the reproduction number was estimated to fall to »0.3 in Wuhan (12) and 0.5 in other provinces (8); Western countries had enforced a comparatively softer version of restrictions. We have shown that these measures enabled rapid reversal of the epidemic trend within 2 weeks, although probably at higher values of the reproduction number.
Dr. Guzzetta is a researcher at the Bruno Kessler Foundation in Trento, Italy. His primary research interests are mathematical models of infectious disease transmission dynamics with a focus on public health applications, assessments of potential risks, and evaluation of effectiveness of interventions.
Members of the COVID-19 working group: Maria Rita Castrucci, Alessandra Ciervo, Fortunato (Paolo) D’Ancona, Corrado Di Benedetto, Antonietta Filia, Stefania Giannitelli, Ornella Punzo, Maria Cristina Rota, Andrea Siddu, Paola Stefanelli, Marco Tallon, and Roberta Urciuoli (Istituto Superiore di Sanità); regional representatives: Antonia Petrucci (Abruzzo), Michele Labianca (Basilicata), Anna Domenica Mignuoli (Calabria), Angelo D’Argenzio (Campania), Erika Massimiliani (Emilia-Romagna), Tolinda Gallo (Friuli Venezia Giulia), Paola Scognamiglio (Lazio), Camilla Sticchi (Liguria), Danilo Cereda (Lombardia), Daniel Fiacchini (Marche), Francesco Sforza (Molise), Maria Grazia Zuccaro (P.A. Bolzano), Pier Paolo Benetollo (P.A. Trento), Donatella Tiberti (Piemonte), Maria Chironna (Puglia), Maria Antonietta Palmas (Sardegna), Salvatore Scondotto (Sicilia), Emanuela Balocchini (Toscana), Anna Tosti (Umbria), Mauro Ruffier (Valle D’Aosta), and Filippo Da Re (Veneto).
Acknowledgment
G.G., V.M., P. Po., F.T., and S.M. acknowledge funding from the European Commission H2020 project MOOD and from the VRT Foundation Trento project “Epidemiologia e transmissione di COVID-19 in Trentino.” M.A. has received research funding unrelated to COVID-19 from Seqirus.
References
- Guzzetta G, Poletti P, Ajelli M, Trentini F, Marziano V, Cereda D, et al. Potential short-term outcome of an uncontrolled COVID-19 epidemic in Lombardy, Italy, February to March 2020. Euro Surveill. 2020;25:
2000293 . DOIPubMedGoogle Scholar - Decree of the Prime Minister. Further implementing provisions of the Decree-Law 23 February 2020, No. 6, with urgent measures in relation to containment and management of the epidemiological emergency from COVID-19, applicable throughout the country. (20A01605) G.U. General Series, no. 64 [in Italian]. 2020 Mar 11 [cited 2020 Oct 6]. http://www.trovanorme.salute.gov.it/norme/dettaglioAtto?id=73643
- Riccardo F, Ajelli M, Andrianou X, Bella A, Del Manso M, Fabiani M, et al. Epidemiological characteristics of COVID-19 cases in Italy and estimates of the reproductive numbers one month into the epidemic. Euro Surveill. In press 2020.
- Munayco CV, Tariq A, Rothenberg R, Soto-Cabezas GG, Reyes MF, Valle A, et al. Early transmission dynamics of COVID-19 in a southern hemisphere setting: Lima, Peru: February 29–March 30, 2020. Infect Dis Model. 2020;5:338–45.
- Muniz-Rodriguez K, Fung IC-H, Ferdosi SR, Ofori SK, Lee Y, Tariq A, et al. Severe acute respiratory syndrome coronavirus 2 transmission potential, Iran, 2020. Emerg Infect Dis. 2020;26:1915–7. DOIPubMedGoogle Scholar
- Park M, Cook AR, Lim JT, Sun Y, Dickens BL. A systematic review of COVID-19 epidemiology based on current evidence. J Clin Med. 2020;9:967. DOIPubMedGoogle Scholar
- Dipartimento di Protezione Civile. COVID-19 Italy—situation monitoring. Github [cited 2020 Oct 6]. https://github.com/pcm-dpc/COVID-19
- Cori A, Ferguson NM, Fraser C, Cauchemez S. A new framework and software to estimate time-varying reproduction numbers during epidemics. Am J Epidemiol. 2013;178:1505–12. DOIPubMedGoogle Scholar
- Zhang J, Litvinova M, Wang W, Wang Y, Deng X, Chen X, et al. Evolving epidemiology and transmission dynamics of coronavirus disease 2019 outside Hubei province, China: a descriptive and modelling study. Lancet Infect Dis. 2020;20:793–802. DOIPubMedGoogle Scholar
- Lavezzo E, Franchin E, Ciavarella C, Cuomo-Dannenburg G, Barzon L, Del Vecchio C, et al.; Imperial College COVID-19 Response Team. Suppression of a SARS-CoV-2 outbreak in the Italian municipality of Vo’. Nature. 2020;584:425–9. DOIPubMedGoogle Scholar
- Ganyani T, Kremer C, Chen D, Torneri A, Faes C Wallinga J et al. Estimating the generation interval for coronavirus disease (COVID-19) based on symptom onset data, March 2020. Euro Surveill 2020;25:2000257.
- Pan A, Liu L, Wang C, Guo H, Hao X, Wang Q, et al. Association of public health interventions with the epidemiology of the COVID-19 outbreak in Wuhan, China. JAMA. 2020.;323:1919–23.
Figures
Cite This ArticleOriginal Publication Date: October 20, 2020
1These authors contributed equally to the article.
2Members of the COVID-19 working group are listed at the end of this article.
3These authors are joint senior authors.
Table of Contents – Volume 27, Number 1—January 2021
| EID Search Options |
|---|
|
|
|
|
|
|
Please use the form below to submit correspondence to the authors or contact them at the following address:
Marco Ajelli, Department of Epidemiology and Biostatistics, Indiana University School of Public Health, 1025 E 7th St, Bloomington, IN 47405, USA
Top